|
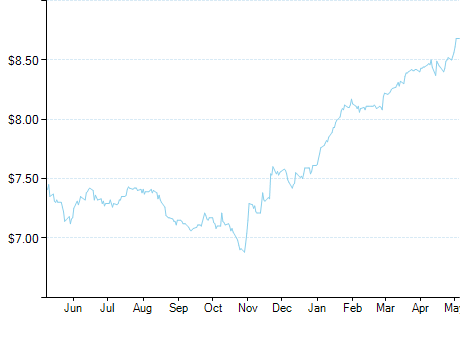
BMO Dow Jones Industrial Average Hgd to CAD (ZDJ)
|
As of March 31, 2024
|
|
(U.S. Equity)
|
|
Underlying Index
|
Dow Jones Industrial Average Index CAD Hedged
|
Inception Return
(5/29/2009)
|
12.10 %
|
|
Day High/Low
|
$59.28 / $58.76
|
|
YTD Return
|
5.86 %
|
|
52Week High/Low
|
$62.24 / $50.62
|
|
|
|
|
|
NAVPS
(4/25/2024)
|
$59.18
|
|
Change
|
 $-0.59 / -0.98 %
|
Open / Close
(4/25/2024)
|
$58.76
/
$59.12
|
|
|
|
Management Fee
|
0.23 %
|
|
Traded Volume
|
3,712
|
|
Assets ($mil)
|
$401.30
|
|
Rank (1Yr)
|
1066/1288
|
|
Std Dev (3Yr)
|
18.18 %
|
|
Beta (3Yr)
|
1.17
|
|
Volatility Ranking (3Yr)
|
9/10
|
|
RRSP Eligibility
|
Yes
|
|
Open to Invest
|
Open
|
|
Annual Dividend
|
$0.92
|
|
Annual Yield
|
1.56 %
|
|
|
Objective
The BMO Dow Jones Industrial Average Hedged to CAD Index ETF has been designed to replicate, to the extent possible, the performance of the Dow Jones Industrial Average (CAD hedged), net of expenses.
|
Fund Manager
BMO Asset Management Inc.
Portfolio Manager
BMO Asset Management Inc.
Sub-Advisor
Data not available
|
|
Asset Allocation
(As of March 31, 2024)
|
Sector Allocation
(As of March 31, 2024)
|
Geographic Allocation
(As of March 31, 2024)
|
Top 10 Holdings
| Name | Asset | Sector | Geographic | Percent |
| UnitedHealth Group Inc | US Equity | Healthcare | United States | 8.13% |
| Microsoft Corp | US Equity | Technology | United States | 6.91% |
| Goldman Sachs Group Inc | US Equity | Financial Services | United States | 6.86% |
| Home Depot Inc | US Equity | Consumer Services | United States | 6.30% |
| Caterpillar Inc | US Equity | Industrial Goods | United States | 6.02% |
| Salesforce Inc | US Equity | Technology | United States | 4.95% |
| Amgen Inc | US Equity | Healthcare | United States | 4.67% |
| Mcdonald's Corp | US Equity | Consumer Services | United States | 4.63% |
| Visa Inc Cl A | US Equity | Financial Services | United States | 4.59% |
| Travelers Cos Inc | US Equity | Financial Services | United States | 3.78% |
Performance Data
(As of March 31, 2024)
|
|
Return (%)
|
Annualized Return (%)
|
|
Return
|
1
Mth
|
3
Mth
|
6
Mth
|
YTD
|
1
Yr
|
3
Yr
|
5
Yr
|
10
Yr
|
|
Fund
|
2.12
|
5.86
|
18.91
|
5.86
|
20.05
|
7.01
|
9.32
|
10.05
|
|
Benchmark
|
3.07
|
13.26
|
23.76
|
13.26
|
30.04
|
14.30
|
15.37
|
15.28
|
|
Quartile Ranking
|
4
|
4
|
4
|
4
|
4
|
4
|
4
|
4
|
|
Calendar Return (%)
|
2023
|
2022
|
2021
|
2020
|
2019
|
2018
|
2017
|
2016
|
2015
|
2014
|
|
Fund
|
14.10
|
-8.41
|
19.65
|
6.61
|
22.83
|
-5.41
|
26.51
|
14.94
|
-0.89
|
9.87
|
|
Benchmark
|
23.32
|
-12.52
|
28.16
|
16.07
|
25.18
|
3.98
|
13.80
|
8.65
|
20.77
|
24.19
|
|
Quartile Ranking
|
4
|
1
|
4
|
4
|
3
|
4
|
1
|
1
|
4
|
4
|