|
BMO Equal Weight Global Base Metals ETF (ZMT)
|
As of March 31, 2024
|
|
(Natural Resources Equity)
|
|
Underlying Index
|
Solactive Equal Weight Global Base Metals Index Canadian Dollar Hedged
|
Inception Return
(10/20/2009)
|
-0.49 %
|
|
Day High/Low
|
$66.00 / $65.17
|
|
YTD Return
|
10.56 %
|
|
52Week High/Low
|
$66.83 / $46.66
|
|
|
|
|
|
NAVPS
(4/18/2024)
|
$65.83
|
|
Change
|
 $0.86 / 1.32 %
|
Open / Close
(4/18/2024)
|
$65.17
/
$65.79
|
|
|
|
Management Fee
|
0.55 %
|
|
Traded Volume
|
2,580
|
|
Assets ($mil)
|
-
|
|
Rank (1Yr)
|
30/117
|
|
Std Dev (3Yr)
|
35.13 %
|
|
Beta (3Yr)
|
1.09
|
|
Volatility Ranking (3Yr)
|
10/10
|
|
RRSP Eligibility
|
Yes
|
|
Open to Invest
|
Open
|
|
Annual Dividend
|
$0.50
|
|
Annual Yield
|
0.75 %
|
|
|
Objective
BMO S&P/TSX Equal Weight Global Base Metals Hedged to CAD Index ETF has been designed to replicate, to the extent possible, the performance of the S&P/TSX Equal Weight Global Base Metals Hedged to CAD Index, net of expenses.
|
Fund Manager
BMO Asset Management Inc.
Portfolio Manager
BMO Asset Management Inc.
Sub-Advisor
Data not available
|
|
Asset Allocation
(As of March 31, 2024)
|
Sector Allocation
(As of March 31, 2024)
|
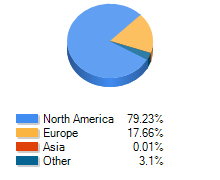
Geographic Allocation
(As of March 31, 2024)
|
Top 10 Holdings
| Name | Asset | Sector | Geographic | Percent |
| Century Aluminum Co | US Equity | Basic Materials | United States | 5.12% |
| Southern Copper Corp | US Equity | Basic Materials | United States | 4.69% |
| Lundin Mining Corp | Canadian Equity | Basic Materials | Canada | 4.54% |
| Kaiser Aluminum Corp | US Equity | Basic Materials | United States | 4.49% |
| Freeport-McMoRan Inc | US Equity | Basic Materials | United States | 4.48% |
| Ero Copper Corp | Canadian Equity | Basic Materials | Canada | 4.42% |
| Solaris Resources Inc | Canadian Equity | Basic Materials | Canada | 4.37% |
| Alcoa Corp | US Equity | Basic Materials | United States | 4.30% |
| Capstone Copper Corp | Canadian Equity | Basic Materials | Canada | 4.26% |
| Ferroglobe PLC | International Equity | Basic Materials | European Union | 4.23% |
Performance Data
(As of March 31, 2024)
|
|
Return (%)
|
Annualized Return (%)
|
|
Return
|
1
Mth
|
3
Mth
|
6
Mth
|
YTD
|
1
Yr
|
3
Yr
|
5
Yr
|
10
Yr
|
|
Fund
|
13.59
|
10.56
|
16.74
|
10.56
|
12.96
|
5.77
|
8.15
|
0.88
|
|
Benchmark
|
10.75
|
8.69
|
8.09
|
8.69
|
5.74
|
12.02
|
8.22
|
2.10
|
|
Quartile Ranking
|
1
|
1
|
1
|
1
|
2
|
4
|
4
|
4
|
|
Calendar Return (%)
|
2023
|
2022
|
2021
|
2020
|
2019
|
2018
|
2017
|
2016
|
2015
|
2014
|
|
Fund
|
15.75
|
-7.56
|
11.07
|
14.44
|
14.67
|
-35.63
|
35.86
|
55.09
|
-46.31
|
-10.45
|
|
Benchmark
|
-0.78
|
12.86
|
21.57
|
-7.01
|
20.06
|
-15.86
|
-1.69
|
36.74
|
-23.78
|
-5.59
|
|
Quartile Ranking
|
1
|
4
|
4
|
1
|
1
|
4
|
1
|
1
|
4
|
3
|