|
BMO MSCI India ESG Leaders Index ETF (ZID)
|
As of March 31, 2024
|
|
(Geographic Equity)
|
|
Underlying Index
|
BNY Mellon India Select DR (Index)
|
Inception Return
(1/19/2010)
|
8.77 %
|
|
Day High/Low
|
$45.97 / $45.51
|
|
YTD Return
|
7.61 %
|
|
52Week High/Low
|
$46.63 / $36.09
|
|
|
|
|
|
NAVPS
(4/17/2024)
|
$45.69
|
|
Change
|
 $-0.26 / -0.57 %
|
Open / Close
(4/17/2024)
|
$45.97
/
$45.76
|
|
|
|
Management Fee
|
0.60 %
|
|
Traded Volume
|
1,619
|
|
Assets ($mil)
|
-
|
|
Rank (1Yr)
|
12/30
|
|
Std Dev (3Yr)
|
24.69 %
|
|
Beta (3Yr)
|
1.21
|
|
Volatility Ranking (3Yr)
|
7/10
|
|
RRSP Eligibility
|
Yes
|
|
Open to Invest
|
Open
|
|
Annual Dividend
|
$0.50
|
|
Annual Yield
|
1.09 %
|
|
|
Objective
BMO MSCI India ESG Leaders Index ETF seeks to replicate, to the extent possible, the performance of an ESG-focused broad Indian equity markets index, net of expenses.
|
Fund Manager
BMO Asset Management Inc.
Portfolio Manager
BMO Asset Management Inc.
Sub-Advisor
Data not available
|
|
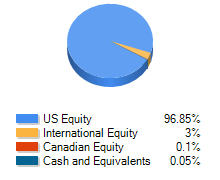
Asset Allocation
(As of March 31, 2024)
|
Sector Allocation
(As of March 31, 2024)
|
Geographic Allocation
(As of March 31, 2024)
|
Top 10 Holdings
| Name | Asset | Sector | Geographic | Percent |
| Reliance Industries Ltd | International Equity | Energy | Other Asian | 17.84% |
| Infosys Ltd | International Equity | Technology | Other Asian | 9.79% |
| Tata Consultancy Services Ltd | International Equity | Technology | Other Asian | 6.92% |
| Bharti Airtel Ltd | International Equity | Telecommunications | Other Asian | 5.47% |
| Axis Bank Ltd | International Equity | Financial Services | Other Asian | 4.71% |
| Bajaj Finance Ltd | International Equity | Financial Services | Other Asian | 3.97% |
| Kotak Mahindra Bank Ltd | International Equity | Financial Services | Other Asian | 3.85% |
| Hindustan Unilever Ltd | International Equity | Consumer Goods | Other Asian | 3.66% |
| Mahindra and Mahindra Ltd | International Equity | Consumer Goods | Other Asian | 3.52% |
| HCL Technologies Ltd | International Equity | Technology | Other Asian | 2.89% |
Performance Data
(As of March 31, 2024)
|
|
Return (%)
|
Annualized Return (%)
|
|
Return
|
1
Mth
|
3
Mth
|
6
Mth
|
YTD
|
1
Yr
|
3
Yr
|
5
Yr
|
10
Yr
|
|
Fund
|
-0.74
|
7.61
|
15.69
|
7.61
|
25.75
|
9.89
|
10.48
|
13.11
|
|
Benchmark
|
4.14
|
6.62
|
15.26
|
6.62
|
13.96
|
9.11
|
9.96
|
7.67
|
|
Quartile Ranking
|
4
|
4
|
3
|
4
|
2
|
2
|
2
|
1
|
|
Calendar Return (%)
|
2023
|
2022
|
2021
|
2020
|
2019
|
2018
|
2017
|
2016
|
2015
|
2014
|
|
Fund
|
11.61
|
-4.43
|
25.77
|
15.41
|
6.98
|
8.85
|
34.30
|
-1.78
|
10.49
|
37.27
|
|
Benchmark
|
11.75
|
-5.84
|
25.09
|
5.60
|
22.88
|
-8.89
|
9.10
|
21.08
|
-8.32
|
10.55
|
|
Quartile Ranking
|
4
|
2
|
1
|
2
|
3
|
1
|
2
|
2
|
4
|
2
|