|
Horizons Active Cdn Dividend ETF (HAL)
|
As of March 31, 2024
|
|
(Canadian Dividend & Income Equity)
|
|
FundGrade A+
® Rating recipient
For more information about FundGrade
click here
2020
2019
2018
Underlying Index
|
|
Inception Return
(2/9/2010)
|
8.42 %
|
|
Day High/Low
|
$19.43 / $19.36
|
|
YTD Return
|
6.84 %
|
|
52Week High/Low
|
$19.96 / $17.26
|
|
|
|
|
|
NAVPS
(4/18/2024)
|
$19.41
|
|
Change
|
 $0.03 / 0.18 %
|
Open / Close
(4/18/2024)
|
$19.43
/
$19.36
|
|
|
|
Management Fee
|
0.55 %
|
|
Traded Volume
|
743
|
|
Assets ($mil)
|
-
|
|
Rank (1Yr)
|
420/448
|
|
Std Dev (3Yr)
|
15.06 %
|
|
Beta (3Yr)
|
0.87
|
|
Volatility Ranking (3Yr)
|
7/10
|
|
RRSP Eligibility
|
Yes
|
|
Open to Invest
|
Open
|
|
Annual Dividend
|
$0.68
|
|
Annual Yield
|
3.50 %
|
|
|
Objective
The investment objective of the HAP Dividend ETF is to seek long-term total returns consisting of regular dividend income and modest long-term capital growth. The HAP Dividend ETF invests primarily in equity securities of major North American companies with above average dividend yields. The HAP Dividend ETF will seek to hedge its U.S. currency exposure at all times.
|
Fund Manager
Horizons ETFs Management (Canada) Inc.
Portfolio Manager
Horizons ETFs Management (Canada) Inc.
Sub-Advisor
Guardian Capital LP
|
|
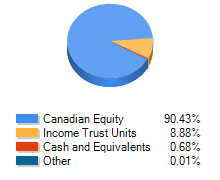
Asset Allocation
(As of March 31, 2024)
|
Sector Allocation
(As of March 31, 2024)
|
Geographic Allocation
(As of March 31, 2024)
|
Top 10 Holdings
| Name | Asset | Sector | Geographic | Percent |
| Royal Bank of Canada | Canadian Equity | Financial Services | Canada | 6.71% |
| Canadian Natural Resources Ltd | Canadian Equity | Energy | Canada | 4.67% |
| WSP Global Inc | Canadian Equity | Real Estate | Canada | 4.03% |
| Exchange Income Corp | Canadian Equity | Industrial Services | Canada | 3.48% |
| Waste Connections Inc | Canadian Equity | Industrial Services | Canada | 3.29% |
| Tourmaline Oil Corp | Canadian Equity | Energy | Canada | 3.28% |
| Altius Minerals Corp | Canadian Equity | Basic Materials | Canada | 3.17% |
| Freehold Royalties Ltd | Canadian Equity | Energy | Canada | 3.13% |
| Aecon Group Inc | Canadian Equity | Real Estate | Canada | 3.10% |
| Power Corp of Canada | Canadian Equity | Financial Services | Canada | 3.04% |
Performance Data
(As of March 31, 2024)
|
|
Return (%)
|
Annualized Return (%)
|
|
Return
|
1
Mth
|
3
Mth
|
6
Mth
|
YTD
|
1
Yr
|
3
Yr
|
5
Yr
|
10
Yr
|
|
Fund
|
3.70
|
6.84
|
11.25
|
6.84
|
6.29
|
8.47
|
7.56
|
7.19
|
|
Benchmark
|
4.14
|
6.62
|
15.26
|
6.62
|
13.96
|
9.11
|
9.96
|
7.67
|
|
Quartile Ranking
|
1
|
1
|
4
|
1
|
4
|
2
|
3
|
2
|
|
Calendar Return (%)
|
2023
|
2022
|
2021
|
2020
|
2019
|
2018
|
2017
|
2016
|
2015
|
2014
|
|
Fund
|
-0.78
|
3.17
|
22.12
|
-3.13
|
27.11
|
-5.66
|
7.52
|
20.02
|
-7.23
|
12.67
|
|
Benchmark
|
11.75
|
-5.84
|
25.09
|
5.60
|
22.88
|
-8.89
|
9.10
|
21.08
|
-8.32
|
10.55
|
|
Quartile Ranking
|
4
|
1
|
4
|
4
|
1
|
2
|
3
|
2
|
3
|
1
|