|
PowerShares Water Resources Portfolio (PHO)
|
Data not available
|
|
(Sector Equity)
|
|
Underlying Index
|
Nasdaq OMX US Water Index
|
Inception Return
(12/6/2005)
|
-
|
|
Day High/Low
|
$63.62 / $63.06
|
|
YTD Return
|
-
|
|
52Week High/Low
|
$66.74 / $49.65
|
|
|
|
|
|
NAVPS
()
|
-
|
|
Change
|
 - / -
- / -
|
Open / Close
(4/18/2024)
|
$63.12
/
$63.13
|
|
|
|
Management Fee
|
0.50 %
|
|
Traded Volume
|
30,485
|
|
Assets ($mil)
|
-
|
|
Rank (1Yr)
|
-
|
|
Std Dev (3Yr)
|
-
|
|
Beta (3Yr)
|
-
|
|
Volatility Ranking (3Yr)
|
-
|
|
RRSP Eligibility
|
Yes
|
|
Open to Invest
|
Open
|
|
Annual Dividend
|
$0.34
|
|
Annual Yield
|
0.55 %
|
|
|
Objective
PowerShares Water Resources Portfolio is an exchange-traded fund incorporated in the USA. The Fund seeks investment results that correspond to the NASDAQ OMX US Water Index a modified equal-weighted index that tracks companies that focus on the provision of potable water and the treatment of water. The ETF holds a majority of water utilities and machinery companies domiciled in the USA & UK.
|
Fund Manager
Data not available
Portfolio Manager
Data not available
Sub-Advisor
Data not available
|
|
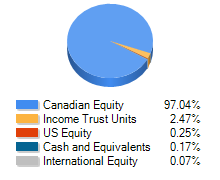
Asset Allocation
(As of March 31, 2024)
|
Sector Allocation
(As of March 31, 2024)
|
Geographic Allocation
(As of March 31, 2024)
|
Top 10 Holdings
| Name | Asset | Sector | Geographic | Percent |
| Ferguson PLC | International Equity | Real Estate | European Union | 7.93% |
| Roper Technologies Inc | US Equity | Industrial Goods | United States | 7.91% |
| Ecolab Inc | US Equity | Basic Materials | United States | 7.89% |
| Danaher Corp | US Equity | Healthcare | United States | 7.58% |
| American Water Works Co Inc | US Equity | Utilities | United States | 6.43% |
| Core & Main Inc Cl A | US Equity | Industrial Goods | United States | 4.61% |
| Pentair PLC | International Equity | Industrial Goods | European Union | 4.22% |
| A O Smith Corp | US Equity | Industrial Goods | United States | 4.04% |
| IDEX Corp | US Equity | Industrial Goods | United States | 3.97% |
| VERALTO CORP | US Equity | Other | United States | 3.94% |
Performance Data
(Data not available)
|
|
Return (%)
|
Annualized Return (%)
|
|
Return
|
1
Mth
|
3
Mth
|
6
Mth
|
YTD
|
1
Yr
|
3
Yr
|
5
Yr
|
10
Yr
|
|
Fund
|
-
|
-
|
-
|
-
|
-
|
-
|
-
|
-
|
|
Benchmark
|
4.30
|
4.07
|
15.01
|
4.07
|
13.82
|
6.42
|
9.65
|
5.50
|
|
Quartile Ranking
|
-
|
-
|
-
|
-
|
-
|
-
|
-
|
-
|
|
Calendar Return (%)
|
2023
|
2022
|
2021
|
2020
|
2019
|
2018
|
2017
|
2016
|
2015
|
2014
|
|
Fund
|
-
|
-
|
-
|
-
|
-
|
-
|
-
|
-
|
-
|
-
|
|
Benchmark
|
14.44
|
-11.86
|
25.62
|
7.72
|
29.06
|
-16.21
|
16.79
|
24.77
|
-23.03
|
1.21
|
|
Quartile Ranking
|
-
|
-
|
-
|
-
|
-
|
-
|
-
|
-
|
-
|
-
|