|
iShares Canadian Fundamental Index ETF (CRQ)
|
As of March 31, 2024
|
|
(Canadian Equity)
|
|
Underlying Index
|
FTSE RAFI Canada Index
|
Inception Return
(2/22/2006)
|
7.06 %
|
|
Day High/Low
|
$22.06 / $22.06
|
|
YTD Return
|
7.01 %
|
|
52Week High/Low
|
$22.50 / $18.76
|
|
|
|
|
|
NAVPS
(4/23/2024)
|
$22.06
|
|
Change
|
 $0.08 / 0.37 %
|
Open / Close
(4/23/2024)
|
$22.06
/
$22.06
|
|
|
|
Management Fee
|
0.65 %
|
|
Traded Volume
|
233
|
|
Assets ($mil)
|
$92.70
|
|
Rank (1Yr)
|
215/703
|
|
Std Dev (3Yr)
|
18.57 %
|
|
Beta (3Yr)
|
1.10
|
|
Volatility Ranking (3Yr)
|
7/10
|
|
RRSP Eligibility
|
Yes
|
|
Open to Invest
|
Open
|
|
Annual Dividend
|
$0.63
|
|
Annual Yield
|
2.84 %
|
|
|
Objective
iShares Canadian Fundamental Index Fund seeks to track, less fees and expenses, the FTSE RAFI Canada Index which comprises those Canadian companies with the highest fundamental weightings. They're selected on the basis of 3 factors aggregated over 5 years: total cash dividends, free cash flow and total sales. Current book equity value is also taken into account.
|
Fund Manager
BlackRock Asset Management Canada Limited
Portfolio Manager
BlackRock Asset Management Canada Limited
Sub-Advisor
BlackRock Institutional Trust Company, N.A.
|
|
Asset Allocation
(As of March 31, 2024)
|
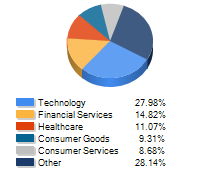
Sector Allocation
(As of March 31, 2024)
|
Geographic Allocation
(As of March 31, 2024)
|
Top 10 Holdings
| Name | Asset | Sector | Geographic | Percent |
| Royal Bank of Canada | Canadian Equity | Financial Services | Canada | 7.64% |
| Toronto-Dominion Bank | Canadian Equity | Financial Services | Canada | 6.99% |
| Bank of Nova Scotia | Canadian Equity | Financial Services | Canada | 5.69% |
| Enbridge Inc | Canadian Equity | Energy | Canada | 5.64% |
| Bank of Montreal | Canadian Equity | Financial Services | Canada | 4.23% |
| Canadian Natural Resources Ltd | Canadian Equity | Energy | Canada | 4.05% |
| Brookfield Corp Cl A | Canadian Equity | Financial Services | Canada | 3.98% |
| Suncor Energy Inc | Canadian Equity | Energy | Canada | 3.87% |
| Canadian Imperial Bank of Commerce | Canadian Equity | Financial Services | Canada | 3.47% |
| Manulife Financial Corp | Canadian Equity | Financial Services | Canada | 3.35% |
Performance Data
(As of March 31, 2024)
|
|
Return (%)
|
Annualized Return (%)
|
|
Return
|
1
Mth
|
3
Mth
|
6
Mth
|
YTD
|
1
Yr
|
3
Yr
|
5
Yr
|
10
Yr
|
|
Fund
|
4.56
|
7.01
|
15.28
|
7.01
|
14.09
|
12.01
|
10.59
|
7.54
|
|
Benchmark
|
4.14
|
6.62
|
15.26
|
6.62
|
13.96
|
9.11
|
9.96
|
7.67
|
|
Quartile Ranking
|
1
|
1
|
2
|
1
|
2
|
1
|
1
|
2
|
|
Calendar Return (%)
|
2023
|
2022
|
2021
|
2020
|
2019
|
2018
|
2017
|
2016
|
2015
|
2014
|
|
Fund
|
9.81
|
0.95
|
34.73
|
-3.56
|
19.86
|
-10.33
|
7.45
|
29.76
|
-11.54
|
6.46
|
|
Benchmark
|
11.75
|
-5.84
|
25.09
|
5.60
|
22.88
|
-8.89
|
9.10
|
21.08
|
-8.32
|
10.55
|
|
Quartile Ranking
|
3
|
1
|
1
|
4
|
3
|
3
|
2
|
1
|
4
|
4
|