|
iShares US Fundamental Index ETF Hedged (CLU)
|
As of March 31, 2024
|
|
(U.S. Equity)
|
|
Underlying Index
|
FTSE RAFI US 1000 Index CAD Hedged
|
Inception Return
(9/8/2006)
|
7.29 %
|
|
Day High/Low
|
$49.46 / $49.21
|
|
YTD Return
|
9.60 %
|
|
52Week High/Low
|
$52.05 / $41.21
|
|
|
|
|
|
NAVPS
(4/18/2024)
|
$49.27
|
|
Change
|
 $0.07 / 0.14 %
|
Open / Close
(4/18/2024)
|
$49.46
/
$49.29
|
|
|
|
Management Fee
|
0.65 %
|
|
Traded Volume
|
2,132
|
|
Assets ($mil)
|
$124.84
|
|
Rank (1Yr)
|
971/1288
|
|
Std Dev (3Yr)
|
19.75 %
|
|
Beta (3Yr)
|
1.21
|
|
Volatility Ranking (3Yr)
|
9/10
|
|
RRSP Eligibility
|
Yes
|
|
Open to Invest
|
Open
|
|
Annual Dividend
|
$0.66
|
|
Annual Yield
|
1.34 %
|
|
|
Objective
iShares US Fundamental Index Fund seeks to track, less fees and expenses, the FTSE RAFI US 1000 C$ Hedged Index, comprised of the largest 1,000 US-listed companies by fundamental value. They're selected on the basis of 3 factors aggregated over 5 years: total cash dividends, free cash flow and total sales. Current book equity value is also taken into account. CLU is hedged against U.S. currency risk.
|
Fund Manager
BlackRock Asset Management Canada Limited
Portfolio Manager
BlackRock Asset Management Canada Limited
Sub-Advisor
BlackRock Institutional Trust Company, N.A.
|
|
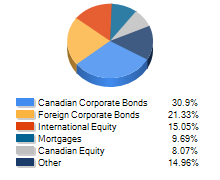
Asset Allocation
(As of March 31, 2024)
|
Sector Allocation
(As of March 31, 2024)
|
Geographic Allocation
(As of March 31, 2024)
|
Top 10 Holdings
| Name | Asset | Sector | Geographic | Percent |
| Berkshire Hathaway Inc Cl B | US Equity | Financial Services | United States | 2.28% |
| Exxon Mobil Corp | US Equity | Energy | United States | 2.12% |
| Microsoft Corp | US Equity | Technology | United States | 1.98% |
| JPMorgan Chase & Co | US Equity | Financial Services | United States | 1.97% |
| Apple Inc | US Equity | Technology | United States | 1.87% |
| Amazon.com Inc | US Equity | Consumer Services | United States | 1.60% |
| Verizon Communications Inc | US Equity | Telecommunications | United States | 1.32% |
| Bank of America Corp | US Equity | Financial Services | United States | 1.23% |
| Chevron Corp | US Equity | Energy | United States | 1.22% |
| Citigroup Inc | US Equity | Financial Services | United States | 1.15% |
Performance Data
(As of March 31, 2024)
|
|
Return (%)
|
Annualized Return (%)
|
|
Return
|
1
Mth
|
3
Mth
|
6
Mth
|
YTD
|
1
Yr
|
3
Yr
|
5
Yr
|
10
Yr
|
|
Fund
|
4.74
|
9.60
|
20.85
|
9.60
|
22.77
|
8.59
|
11.32
|
9.02
|
|
Benchmark
|
3.07
|
13.26
|
23.76
|
13.26
|
30.04
|
14.30
|
15.37
|
15.28
|
|
Quartile Ranking
|
1
|
4
|
3
|
4
|
4
|
4
|
3
|
4
|
|
Calendar Return (%)
|
2023
|
2022
|
2021
|
2020
|
2019
|
2018
|
2017
|
2016
|
2015
|
2014
|
|
Fund
|
13.36
|
-9.32
|
29.60
|
4.36
|
24.96
|
-10.45
|
14.54
|
15.64
|
-4.09
|
11.94
|
|
Benchmark
|
23.32
|
-12.52
|
28.16
|
16.07
|
25.18
|
3.98
|
13.80
|
8.65
|
20.77
|
24.19
|
|
Quartile Ranking
|
4
|
1
|
1
|
4
|
2
|
4
|
2
|
1
|
4
|
4
|