|
iShares Japan Fundamental Index ETF C$ Hgd (CJP)
|
As of March 31, 2024
|
|
(Geographic Equity)
|
|
Underlying Index
|
FTSE RAFI Japan Index CAD Hedged
|
Inception Return
(2/14/2007)
|
3.41 %
|
|
Day High/Low
|
$27.38 / $27.13
|
|
YTD Return
|
21.19 %
|
|
52Week High/Low
|
$28.38 / $18.48
|
|
|
|
|
|
NAVPS
(4/18/2024)
|
$27.30
|
|
Change
|
 $0.14 / 0.52 %
|
Open / Close
(4/18/2024)
|
$27.21
/
$27.14
|
|
|
|
Management Fee
|
0.65 %
|
|
Traded Volume
|
13,270
|
|
Assets ($mil)
|
$121.56
|
|
Rank (1Yr)
|
2/30
|
|
Std Dev (3Yr)
|
16.72 %
|
|
Beta (3Yr)
|
0.68
|
|
Volatility Ranking (3Yr)
|
6/10
|
|
RRSP Eligibility
|
Yes
|
|
Open to Invest
|
Open
|
|
Annual Dividend
|
$0.28
|
|
Annual Yield
|
1.04 %
|
|
|
Objective
iShares Japan Fundamental Index Fund seeks to track the FTSE RAFI Japan C$ Hedged Index, less fees and expenses. CJP selects constituents by 3 accounting factors (tracked over 5 consecutive years) including: total cash dividends, free cash flow and total sales, as well as, current-period book equity value. CJP offers lower costs with a hedged exposure to the Yen, reducing risks for Canadians.
|
Fund Manager
BlackRock Asset Management Canada Limited
Portfolio Manager
BlackRock Asset Management Canada Limited
Sub-Advisor
BlackRock Institutional Trust Company, N.A.
|
|
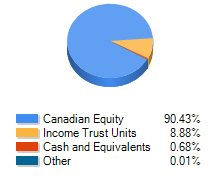
Asset Allocation
(As of March 31, 2024)
|
Sector Allocation
(As of March 31, 2024)
|
Geographic Allocation
(As of March 31, 2024)
|
Top 10 Holdings
| Name | Asset | Sector | Geographic | Percent |
| Toyota Motor Corp | International Equity | Consumer Goods | Japan | 6.33% |
| Mitsubishi UFJ Financial Group Inc | International Equity | Financial Services | Japan | 3.37% |
| Sumitomo Mitsui Financial Group Inc | International Equity | Financial Services | Japan | 2.61% |
| Mitsubishi Corp | International Equity | Industrial Services | Japan | 2.28% |
| Sony Group Corp | International Equity | Consumer Goods | Japan | 2.04% |
| Honda Motor Co Ltd | International Equity | Consumer Goods | Japan | 1.96% |
| Mizuho Financial Group Inc | International Equity | Financial Services | Japan | 1.90% |
| SoftBank Group Corp | International Equity | Telecommunications | Japan | 1.74% |
| Hitachi Ltd | International Equity | Industrial Goods | Japan | 1.59% |
| Mitsui & Co Ltd | International Equity | Industrial Services | Japan | 1.43% |
Performance Data
(As of March 31, 2024)
|
|
Return (%)
|
Annualized Return (%)
|
|
Return
|
1
Mth
|
3
Mth
|
6
Mth
|
YTD
|
1
Yr
|
3
Yr
|
5
Yr
|
10
Yr
|
|
Fund
|
4.90
|
21.19
|
22.58
|
21.19
|
52.36
|
20.67
|
16.35
|
11.29
|
|
Benchmark
|
4.14
|
6.62
|
15.26
|
6.62
|
13.96
|
9.11
|
9.96
|
7.67
|
|
Quartile Ranking
|
1
|
1
|
1
|
1
|
1
|
1
|
1
|
1
|
|
Calendar Return (%)
|
2023
|
2022
|
2021
|
2020
|
2019
|
2018
|
2017
|
2016
|
2015
|
2014
|
|
Fund
|
33.78
|
5.61
|
17.83
|
-1.48
|
13.84
|
-16.38
|
19.94
|
-0.51
|
9.85
|
8.31
|
|
Benchmark
|
11.75
|
-5.84
|
25.09
|
5.60
|
22.88
|
-8.89
|
9.10
|
21.08
|
-8.32
|
10.55
|
|
Quartile Ranking
|
1
|
1
|
2
|
4
|
2
|
4
|
3
|
2
|
4
|
3
|