|
Invesco Canadian Dividend Index ETF (PDC)
|
As of March 31, 2024
|
|
(Canadian Dividend & Income Equity)
|
|
FundGrade A+
® Rating recipient
For more information about FundGrade
click here
Underlying Index
|
NASDAQ Select Canadian Dividend Index
|
Inception Return
(6/16/2011)
|
8.11 %
|
|
Day High/Low
|
$30.03 / $29.84
|
|
YTD Return
|
4.45 %
|
|
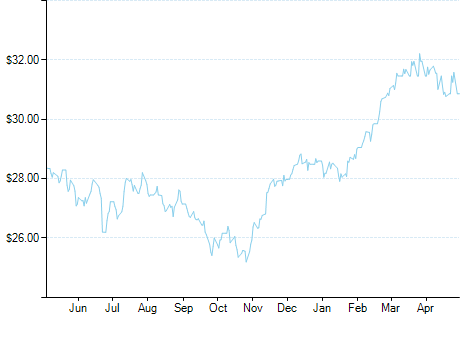
52Week High/Low
|
$31.35 / $26.71
|
|
|
|
|
|
NAVPS
(4/18/2024)
|
$29.97
|
|
Change
|
 $0.16 / 0.53 %
|
Open / Close
(4/18/2024)
|
$29.94
/
$29.97
|
|
|
|
Management Fee
|
0.50 %
|
|
Traded Volume
|
4,801
|
|
Assets ($mil)
|
$782.70
|
|
Rank (1Yr)
|
351/448
|
|
Std Dev (3Yr)
|
15.80 %
|
|
Beta (3Yr)
|
0.89
|
|
Volatility Ranking (3Yr)
|
7/10
|
|
RRSP Eligibility
|
Yes
|
|
Open to Invest
|
Open
|
|
Annual Dividend
|
$1.48
|
|
Annual Yield
|
4.93 %
|
|
|
Objective
PDC seeks to replicate, to the extent reasonably possible and before fees and expenses, the performance of the NASDAQ Select Canadian Dividend Index, or any successor thereto. This Invesco ETF invests primarily in Canadian equity securities.
|
Fund Manager
Invesco Canada Ltd.
Portfolio Manager
Invesco Canada Ltd.
Sub-Advisor
Invesco Capital Management LLC
|
|
Asset Allocation
(As of March 31, 2024)
|
Sector Allocation
(As of March 31, 2024)
|
Geographic Allocation
(As of March 31, 2024)
|
Top 10 Holdings
| Name | Asset | Sector | Geographic | Percent |
| Bank of Montreal | Canadian Equity | Financial Services | Canada | 8.27% |
| Enbridge Inc | Canadian Equity | Energy | Canada | 8.06% |
| Royal Bank of Canada | Canadian Equity | Financial Services | Canada | 7.96% |
| Bank of Nova Scotia | Canadian Equity | Financial Services | Canada | 7.83% |
| Toronto-Dominion Bank | Canadian Equity | Financial Services | Canada | 7.71% |
| Canadian Natural Resources Ltd | Canadian Equity | Energy | Canada | 4.28% |
| National Bank of Canada | Canadian Equity | Financial Services | Canada | 4.18% |
| Canadian Imperial Bank of Commerce | Canadian Equity | Financial Services | Canada | 4.16% |
| Manulife Financial Corp | Canadian Equity | Financial Services | Canada | 4.03% |
| Nutrien Ltd | Canadian Equity | Basic Materials | Canada | 4.03% |
Performance Data
(As of March 31, 2024)
|
|
Return (%)
|
Annualized Return (%)
|
|
Return
|
1
Mth
|
3
Mth
|
6
Mth
|
YTD
|
1
Yr
|
3
Yr
|
5
Yr
|
10
Yr
|
|
Fund
|
3.92
|
4.45
|
13.60
|
4.45
|
8.96
|
7.80
|
7.62
|
6.94
|
|
Benchmark
|
4.14
|
6.62
|
15.26
|
6.62
|
13.96
|
9.11
|
9.96
|
7.67
|
|
Quartile Ranking
|
1
|
4
|
2
|
4
|
4
|
3
|
3
|
2
|
|
Calendar Return (%)
|
2023
|
2022
|
2021
|
2020
|
2019
|
2018
|
2017
|
2016
|
2015
|
2014
|
|
Fund
|
6.98
|
-4.12
|
29.96
|
-5.29
|
24.72
|
-11.86
|
10.58
|
23.33
|
-8.97
|
11.60
|
|
Benchmark
|
11.75
|
-5.84
|
25.09
|
5.60
|
22.88
|
-8.89
|
9.10
|
21.08
|
-8.32
|
10.55
|
|
Quartile Ranking
|
3
|
3
|
1
|
4
|
1
|
4
|
1
|
1
|
4
|
2
|