|
BMO Covered Call Utilities ETF (ZWU)
|
As of March 31, 2024
|
|
(Sector Equity)
|
|
Underlying Index
|
|
Inception Return
(10/20/2011)
|
3.87 %
|
|
Day High/Low
|
$9.77 / $9.69
|
|
YTD Return
|
0.77 %
|
|
52Week High/Low
|
$11.71 / $9.27
|
|
|
|
|
|
NAVPS
(4/17/2024)
|
$9.75
|
|
Change
|
 $0.07 / 0.71 %
|
Open / Close
(4/17/2024)
|
$9.69
/
$9.76
|
|
|
|
Management Fee
|
0.65 %
|
|
Traded Volume
|
260,759
|
|
Assets ($mil)
|
-
|
|
Rank (1Yr)
|
161/177
|
|
Std Dev (3Yr)
|
13.49 %
|
|
Beta (3Yr)
|
0.70
|
|
Volatility Ranking (3Yr)
|
6/10
|
|
RRSP Eligibility
|
Yes
|
|
Open to Invest
|
Open
|
|
Annual Dividend
|
$0.85
|
|
Annual Yield
|
8.71 %
|
|
|
Objective
BMO Covered Call Utilities ETF has been designed to provide exposure to an equal weight portfolio of utilities, telecoms and pipeline companies, while earning call option premiums.
|
Fund Manager
BMO Asset Management Inc.
Portfolio Manager
BMO Asset Management Inc.
Sub-Advisor
Data not available
|
|
Asset Allocation
(As of March 31, 2024)
|
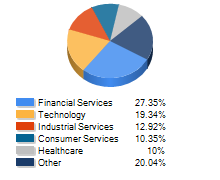
Sector Allocation
(As of March 31, 2024)
|
Geographic Allocation
(As of March 31, 2024)
|
Top 10 Holdings
| Name | Asset | Sector | Geographic | Percent |
| BMO Equal Weight Utilities Index ETF (ZUT) | Other | Exchange Traded Fund | Canada | 5.88% |
| Enbridge Inc | Canadian Equity | Energy | Canada | 5.04% |
| Pembina Pipeline Corp | Canadian Equity | Energy | Canada | 4.97% |
| TC Energy Corp | Canadian Equity | Energy | Canada | 4.96% |
| Fortis Inc | Canadian Equity | Utilities | Canada | 4.94% |
| Verizon Communications Inc | US Equity | Telecommunications | United States | 4.69% |
| Nextera Energy Inc | US Equity | Utilities | United States | 4.69% |
| PPL Corp | US Equity | Utilities | United States | 4.56% |
| Duke Energy Corp | US Equity | Utilities | United States | 4.55% |
| BCE Inc | Canadian Equity | Telecommunications | Canada | 4.50% |
Performance Data
(As of March 31, 2024)
|
|
Return (%)
|
Annualized Return (%)
|
|
Return
|
1
Mth
|
3
Mth
|
6
Mth
|
YTD
|
1
Yr
|
3
Yr
|
5
Yr
|
10
Yr
|
|
Fund
|
2.01
|
0.77
|
9.24
|
0.77
|
-2.87
|
0.78
|
2.10
|
3.10
|
|
Benchmark
|
4.14
|
6.62
|
15.26
|
6.62
|
13.96
|
9.11
|
9.96
|
7.67
|
|
Quartile Ranking
|
2
|
4
|
4
|
4
|
4
|
4
|
4
|
4
|
|
Calendar Return (%)
|
2023
|
2022
|
2021
|
2020
|
2019
|
2018
|
2017
|
2016
|
2015
|
2014
|
|
Fund
|
-2.58
|
-4.06
|
15.83
|
-7.13
|
23.44
|
-5.51
|
5.69
|
19.51
|
-15.24
|
14.39
|
|
Benchmark
|
11.75
|
-5.84
|
25.09
|
5.60
|
22.88
|
-8.89
|
9.10
|
21.08
|
-8.32
|
10.55
|
|
Quartile Ranking
|
4
|
1
|
3
|
4
|
2
|
4
|
4
|
1
|
4
|
4
|