|
BMO Equal Weight Industrials Index ETF (ZIN)
|
As of March 31, 2024
|
|
(Sector Equity)
|
|
Underlying Index
|
Solactive Equal Weight Canada Industrials Index
|
Inception Return
(11/14/2012)
|
11.12 %
|
|
Day High/Low
|
$38.54 / $38.54
|
|
YTD Return
|
7.14 %
|
|
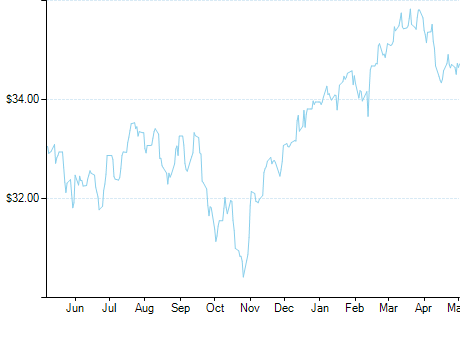
52Week High/Low
|
$40.17 / $31.29
|
|
|
|
|
|
NAVPS
(4/24/2024)
|
$38.47
|
|
Change
|
 $-0.29 / -0.76 %
|
Open / Close
(4/24/2024)
|
$38.54
/
$38.54
|
|
|
|
Management Fee
|
0.55 %
|
|
Traded Volume
|
233
|
|
Assets ($mil)
|
$50.74
|
|
Rank (1Yr)
|
106/177
|
|
Std Dev (3Yr)
|
24.79 %
|
|
Beta (3Yr)
|
1.44
|
|
Volatility Ranking (3Yr)
|
8/10
|
|
RRSP Eligibility
|
Yes
|
|
Open to Invest
|
Open
|
|
Annual Dividend
|
$0.62
|
|
Annual Yield
|
1.61 %
|
|
|
Objective
BMO S&P/TSX Equal Weight Industrials Index ETF has been designed to replicate, to the extent possible, the performance of the S&P/TSX Equal Weight Industrials Index, net of expenses.
|
Fund Manager
BMO Asset Management Inc.
Portfolio Manager
BMO Asset Management Inc.
Sub-Advisor
Data not available
|
|
Asset Allocation
(As of March 31, 2024)
|
Sector Allocation
(As of March 31, 2024)
|
Geographic Allocation
(As of March 31, 2024)
|
Top 10 Holdings
| Name | Asset | Sector | Geographic | Percent |
| NFI Group Inc | Canadian Equity | Industrial Goods | Canada | 2.95% |
| Bombardier Inc Cl B | Canadian Equity | Industrial Goods | Canada | 2.86% |
| Air Canada | Canadian Equity | Industrial Services | Canada | 2.86% |
| Finning International Inc | Canadian Equity | Industrial Goods | Canada | 2.86% |
| Badger Infrastructure Solutions Ltd | Canadian Equity | Real Estate | Canada | 2.83% |
| Galaxy Digital Holdings Ltd | US Equity | Financial Services | United States | 2.81% |
| TFI International Inc | Canadian Equity | Industrial Services | Canada | 2.78% |
| BRP Inc | Canadian Equity | Consumer Goods | Canada | 2.77% |
| ALGOMA STEEL GROUP INC | Canadian Equity | Other | Canada | 2.75% |
| Brookfield Business Partners LP - Units | Income Trust Units | Real Estate | Latin America | 2.73% |
Performance Data
(As of March 31, 2024)
|
|
Return (%)
|
Annualized Return (%)
|
|
Return
|
1
Mth
|
3
Mth
|
6
Mth
|
YTD
|
1
Yr
|
3
Yr
|
5
Yr
|
10
Yr
|
|
Fund
|
3.90
|
7.14
|
15.59
|
7.14
|
13.68
|
7.51
|
9.97
|
8.14
|
|
Benchmark
|
4.14
|
6.62
|
15.26
|
6.62
|
13.96
|
9.11
|
9.96
|
7.67
|
|
Quartile Ranking
|
1
|
3
|
3
|
3
|
3
|
2
|
2
|
4
|
|
Calendar Return (%)
|
2023
|
2022
|
2021
|
2020
|
2019
|
2018
|
2017
|
2016
|
2015
|
2014
|
|
Fund
|
19.38
|
-8.10
|
17.87
|
7.71
|
20.85
|
-5.91
|
17.88
|
31.36
|
-14.08
|
-0.85
|
|
Benchmark
|
11.75
|
-5.84
|
25.09
|
5.60
|
22.88
|
-8.89
|
9.10
|
21.08
|
-8.32
|
10.55
|
|
Quartile Ranking
|
2
|
2
|
2
|
4
|
3
|
4
|
2
|
1
|
4
|
4
|