|
BMO Laddered Preferred Share Index ETF (ZPR)
|
As of March 31, 2024
|
|
(Preferred Share Fixed Income)
|
|
Underlying Index
|
Solactive Laddered Canadian Preferred Share Index
|
Inception Return
(11/14/2012)
|
1.38 %
|
|
Day High/Low
|
$10.01 / $9.96
|
|
YTD Return
|
10.36 %
|
|
52Week High/Low
|
$10.03 / $8.12
|
|
|
|
|
|
NAVPS
(4/18/2024)
|
$10.02
|
|
Change
|
 $0.01 / 0.10 %
|
Open / Close
(4/18/2024)
|
$9.96
/
$9.99
|
|
|
|
Management Fee
|
0.45 %
|
|
Traded Volume
|
159,700
|
|
Assets ($mil)
|
-
|
|
Rank (1Yr)
|
15/70
|
|
Std Dev (3Yr)
|
17.87 %
|
|
Beta (3Yr)
|
1.10
|
|
Volatility Ranking (3Yr)
|
6/10
|
|
RRSP Eligibility
|
Yes
|
|
Open to Invest
|
Open
|
|
Annual Dividend
|
$0.54
|
|
Annual Yield
|
5.41 %
|
|
|
Objective
BMO Laddered Preferred Share Index ETF has been designed to replicate, to the extent possible, the performance of the Solactive Laddered Canadian Preferred Share Index, net of expenses. The Fund invests in and holds the Constituent Securities of the Index in the same proportion as they are reflected in the Index.
|
Fund Manager
BMO Asset Management Inc.
Portfolio Manager
BMO Asset Management Inc.
Sub-Advisor
Data not available
|
|
Asset Allocation
(As of March 31, 2024)
|
Sector Allocation
(As of March 31, 2024)
|
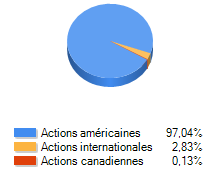
Geographic Allocation
(As of March 31, 2024)
|
Top 10 Holdings
| Name | Asset | Sector | Geographic | Percent |
| Toronto-Dominion Bank - Pfd Sr 16 | Canadian Equity | Financial Services | Canada | 2.86% |
| National Bank of Canada - Pfd Sr 38 | Canadian Equity | Financial Services | Canada | 2.65% |
| BCE Inc - Pfd Sr AK | Canadian Equity | Telecommunications | Canada | 2.60% |
| Enbridge Inc - Pfd Sr B | Canadian Equity | Energy | Canada | 1.97% |
| Royal Bank of Canada - Pfd Sr BD | Canadian Equity | Financial Services | Canada | 1.67% |
| Sun Life Financial Inc - Pfd Cl A Sr 10R | Canadian Equity | Financial Services | Canada | 1.55% |
| Canadian Utilities Ltd - Pfd Sr Y | Canadian Equity | Utilities | Canada | 1.47% |
| Emera Inc - Pfd Sr J | Canadian Equity | Utilities | Canada | 1.40% |
| Power Financial Corp - Pfd Sr P | Canadian Equity | Financial Services | Canada | 1.37% |
| Toronto-Dominion Bank - Pfd Cl A Sr 5 | Canadian Equity | Financial Services | Canada | 1.37% |
Performance Data
(As of March 31, 2024)
|
|
Return (%)
|
Annualized Return (%)
|
|
Return
|
1
Mth
|
3
Mth
|
6
Mth
|
YTD
|
1
Yr
|
3
Yr
|
5
Yr
|
10
Yr
|
|
Fund
|
3.65
|
10.36
|
19.26
|
10.36
|
17.54
|
2.60
|
5.33
|
1.62
|
|
Benchmark
|
3.47
|
9.62
|
17.59
|
9.62
|
13.52
|
1.41
|
4.28
|
2.13
|
|
Quartile Ranking
|
2
|
2
|
1
|
2
|
1
|
2
|
2
|
4
|
|
Calendar Return (%)
|
2023
|
2022
|
2021
|
2020
|
2019
|
2018
|
2017
|
2016
|
2015
|
2014
|
|
Fund
|
6.98
|
-17.39
|
23.50
|
6.04
|
1.79
|
-9.35
|
14.46
|
6.79
|
-20.22
|
4.72
|
|
Benchmark
|
5.90
|
-18.08
|
19.35
|
6.16
|
3.48
|
-7.93
|
13.62
|
6.98
|
-14.95
|
6.82
|
|
Quartile Ranking
|
2
|
2
|
2
|
2
|
3
|
3
|
2
|
4
|
4
|
4
|