|
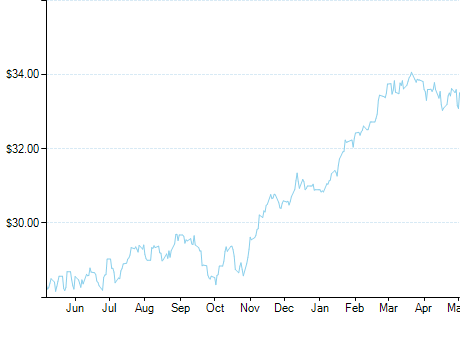
BMO Mid-Term U.S. IG Corp Bond Hedged to CAD (ZMU)
|
As of March 31, 2024
|
|
(Global Corporate Fixed Income)
|
|
Underlying Index
|
Bloomberg Barclays US Investment Grade 5 to 10 Year Corporate Bond Capped Index CAD Hedged
|
Inception Return
(3/27/2013)
|
2.04 %
|
|
Day High/Low
|
$12.30 / $12.27
|
|
YTD Return
|
-0.60 %
|
|
52Week High/Low
|
$12.87 / $11.65
|
|
|
|
|
|
NAVPS
(4/22/2024)
|
$12.28
|
|
Change
|
 $0.02 / 0.14 %
|
Open / Close
(4/22/2024)
|
$12.27
/
$12.30
|
|
|
|
Management Fee
|
0.25 %
|
|
Traded Volume
|
5,333
|
|
Assets ($mil)
|
$2,754.27
|
|
Rank (1Yr)
|
97/112
|
|
Std Dev (3Yr)
|
7.16 %
|
|
Beta (3Yr)
|
0.68
|
|
Volatility Ranking (3Yr)
|
4/10
|
|
RRSP Eligibility
|
Yes
|
|
Open to Invest
|
Open
|
|
Annual Dividend
|
$0.54
|
|
Annual Yield
|
4.39 %
|
|
|
Objective
The BMO Mid-Term US IG Corporate Bond Hedged to CAD Index ETF has been designed to replicate, to the extent possible, the performance of the Barclay's U.S. Investment Grade 5-10 Year Corporate Bond CAD Hedged Index, net of expenses.
|
Fund Manager
BMO Asset Management Inc.
Portfolio Manager
BMO Asset Management Inc.
Sub-Advisor
Data not available
|
|
Asset Allocation
(As of March 31, 2024)
|
Sector Allocation
(As of March 31, 2024)
|
Geographic Allocation
(As of March 31, 2024)
|
Top 10 Holdings
| Name | Asset | Sector | Geographic | Percent |
| BMO Mid-Term US IG Corporate Bond Ix ETF (ZIC) | Foreign Bonds | Fixed Income | Multi-National | 99.91% |
| CAD Currency Forward | Cash and Equivalents | Cash and Cash Equivalent | Canada | 0.25% |
| CANADIAN DOLLAR | Cash and Equivalents | Cash and Cash Equivalent | Canada | 0.00% |
| USD Currency Forward | Cash and Equivalents | Cash and Cash Equivalent | United States | -0.17% |
Performance Data
(As of March 31, 2024)
|
|
Return (%)
|
Annualized Return (%)
|
|
Return
|
1
Mth
|
3
Mth
|
6
Mth
|
YTD
|
1
Yr
|
3
Yr
|
5
Yr
|
10
Yr
|
|
Fund
|
1.23
|
-0.60
|
7.35
|
-0.60
|
3.43
|
-2.21
|
0.90
|
2.23
|
|
Benchmark
|
0.87
|
1.89
|
7.97
|
1.89
|
5.13
|
-0.37
|
1.00
|
3.49
|
|
Quartile Ranking
|
1
|
4
|
3
|
4
|
4
|
4
|
3
|
3
|
|
Calendar Return (%)
|
2023
|
2022
|
2021
|
2020
|
2019
|
2018
|
2017
|
2016
|
2015
|
2014
|
|
Fund
|
7.68
|
-14.50
|
-2.02
|
8.51
|
13.22
|
-3.00
|
4.65
|
4.79
|
1.85
|
7.68
|
|
Benchmark
|
6.54
|
-10.63
|
-3.78
|
8.39
|
5.81
|
5.22
|
2.08
|
0.66
|
15.41
|
12.44
|
|
Quartile Ranking
|
3
|
4
|
4
|
1
|
1
|
4
|
3
|
4
|
2
|
1
|