|
BMO Low Volatility US Equity ETF (ZLU)
|
As of March 31, 2024
|
|
(U.S. Equity)
|
|
FundGrade A+
® Rating recipient
For more information about FundGrade
click here
2016
Underlying Index
|
|
Inception Return
(3/27/2013)
|
13.54 %
|
|
Day High/Low
|
$48.48 / $48.30
|
|
YTD Return
|
8.60 %
|
|
52Week High/Low
|
$49.82 / $43.64
|
|
|
|
|
|
NAVPS
(4/18/2024)
|
$48.49
|
|
Change
|
 $0.22 / 0.46 %
|
Open / Close
(4/18/2024)
|
$48.31
/
$48.46
|
|
|
|
Management Fee
|
0.30 %
|
|
Traded Volume
|
10,022
|
|
Assets ($mil)
|
-
|
|
Rank (1Yr)
|
1278/1288
|
|
Std Dev (3Yr)
|
12.06 %
|
|
Beta (3Yr)
|
0.67
|
|
Volatility Ranking (3Yr)
|
4/10
|
|
RRSP Eligibility
|
Yes
|
|
Open to Invest
|
Open
|
|
Annual Dividend
|
$1.10
|
|
Annual Yield
|
2.27 %
|
|
|
Objective
BMO Low Volatility US Equity ETF has been designed to provide exposure to a low beta weighted portfolio of U.S. stocks. Beta measures the security's sensitivity to market movements.
|
Fund Manager
BMO Asset Management Inc.
Portfolio Manager
BMO Asset Management Inc.
Sub-Advisor
Data not available
|
|
Asset Allocation
(As of March 31, 2024)
|
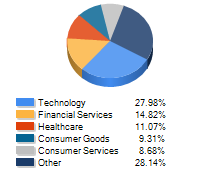
Sector Allocation
(As of March 31, 2024)
|
Geographic Allocation
(As of March 31, 2024)
|
Top 10 Holdings
| Name | Asset | Sector | Geographic | Percent |
| Merck & Co Inc | US Equity | Healthcare | United States | 1.78% |
| J M Smucker Co | US Equity | Consumer Goods | United States | 1.71% |
| Campbell Soup Co | US Equity | Consumer Goods | United States | 1.70% |
| International Business Machines Corp | US Equity | Technology | United States | 1.64% |
| CBOE Global Markets Inc | US Equity | Financial Services | United States | 1.61% |
| Abbvie Inc | US Equity | Healthcare | United States | 1.51% |
| General Mills Inc | US Equity | Consumer Goods | United States | 1.50% |
| Johnson & Johnson | US Equity | Healthcare | United States | 1.47% |
| Kroger Co | US Equity | Consumer Services | United States | 1.46% |
| Waste Management Inc | US Equity | Industrial Services | United States | 1.45% |
Performance Data
(As of March 31, 2024)
|
|
Return (%)
|
Annualized Return (%)
|
|
Return
|
1
Mth
|
3
Mth
|
6
Mth
|
YTD
|
1
Yr
|
3
Yr
|
5
Yr
|
10
Yr
|
|
Fund
|
3.96
|
8.60
|
13.13
|
8.60
|
6.73
|
9.91
|
8.99
|
12.26
|
|
Benchmark
|
3.07
|
13.26
|
23.76
|
13.26
|
30.04
|
14.30
|
15.37
|
15.28
|
|
Quartile Ranking
|
1
|
4
|
4
|
4
|
4
|
3
|
4
|
2
|
|
Calendar Return (%)
|
2023
|
2022
|
2021
|
2020
|
2019
|
2018
|
2017
|
2016
|
2015
|
2014
|
|
Fund
|
-3.11
|
7.98
|
20.63
|
2.16
|
20.32
|
8.49
|
5.10
|
5.74
|
26.59
|
34.98
|
|
Benchmark
|
23.32
|
-12.52
|
28.16
|
16.07
|
25.18
|
3.98
|
13.80
|
8.65
|
20.77
|
24.19
|
|
Quartile Ranking
|
4
|
1
|
3
|
4
|
4
|
1
|
4
|
2
|
1
|
1
|