|
Vanguard Growth ETF (VUG)
|
Data not available
|
|
(U.S. Equity)
|
|
Underlying Index
|
CRSP U.S. Large Cap Growth Index
|
Inception Return
(1/30/2004)
|
-
|
|
Day High/Low
|
$334.03 / $329.51
|
|
YTD Return
|
-
|
|
52Week High/Low
|
$348.88 / $242.98
|
|
|
|
|
|
NAVPS
()
|
-
|
|
Change
|
 - / -
- / -
|
Open / Close
(4/24/2024)
|
$333.79
/
$331.07
|
|
|
|
Management Fee
|
-
|
|
Traded Volume
|
790,757
|
|
Assets ($mil)
|
-
|
|
Rank (1Yr)
|
-
|
|
Std Dev (3Yr)
|
-
|
|
Beta (3Yr)
|
-
|
|
Volatility Ranking (3Yr)
|
-
|
|
RRSP Eligibility
|
Yes
|
|
Open to Invest
|
Open
|
|
Annual Dividend
|
$1.84
|
|
Annual Yield
|
0.56 %
|
|
|
Objective
Vanguard Growth ETF is an exchange-traded fund incorporated in the USA. The Fund seeks to track the performance of the CRSP U.S. Large Cap Growth Index. The Fund invests all of its assets in the stocks that make up the Index holding each stock in the same proportion as its weighting in the Index.
|
Fund Manager
Data not available
Portfolio Manager
Data not available
Sub-Advisor
Data not available
|
|
Asset Allocation
(As of March 31, 2024)
|
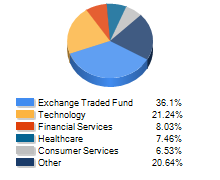
Sector Allocation
(As of March 31, 2024)
|
Geographic Allocation
(As of March 31, 2024)
|
Top 10 Holdings
| Name | Asset | Sector | Geographic | Percent |
| Microsoft Corp | US Equity | Technology | United States | 12.88% |
| Apple Inc | US Equity | Technology | United States | 11.19% |
| NVIDIA Corp | US Equity | Technology | United States | 7.78% |
| Amazon.com Inc | US Equity | Consumer Services | United States | 6.89% |
| Meta Platforms Inc Cl A | US Equity | Technology | United States | 4.56% |
| Alphabet Inc Cl A | US Equity | Technology | United States | 3.43% |
| Alphabet Inc Cl C | US Equity | Technology | United States | 2.84% |
| Eli Lilly and Co | US Equity | Healthcare | United States | 2.70% |
| Tesla Inc | US Equity | Consumer Goods | United States | 2.29% |
| Visa Inc Cl A | US Equity | Financial Services | United States | 1.81% |
Performance Data
(Data not available)
|
|
Return (%)
|
Annualized Return (%)
|
|
Return
|
1
Mth
|
3
Mth
|
6
Mth
|
YTD
|
1
Yr
|
3
Yr
|
5
Yr
|
10
Yr
|
|
Fund
|
-
|
-
|
-
|
-
|
-
|
-
|
-
|
-
|
|
Benchmark
|
3.22
|
10.56
|
23.48
|
10.56
|
29.88
|
11.49
|
15.05
|
12.96
|
|
Quartile Ranking
|
-
|
-
|
-
|
-
|
-
|
-
|
-
|
-
|
|
Calendar Return (%)
|
2023
|
2022
|
2021
|
2020
|
2019
|
2018
|
2017
|
2016
|
2015
|
2014
|
|
Fund
|
-
|
-
|
-
|
-
|
-
|
-
|
-
|
-
|
-
|
-
|
|
Benchmark
|
26.29
|
-18.11
|
28.71
|
18.40
|
31.49
|
-4.38
|
21.83
|
11.96
|
1.38
|
13.69
|
|
Quartile Ranking
|
-
|
-
|
-
|
-
|
-
|
-
|
-
|
-
|
-
|
-
|