|
Vanguard Emerging Markets ETF (VWO)
|
Data not available
|
|
(Emerging Markets Equity)
|
|
Underlying Index
|
FTSE Emerging Markets Index
|
Inception Return
(3/10/2005)
|
-
|
|
Day High/Low
|
$41.20 / $40.91
|
|
YTD Return
|
-
|
|
52Week High/Low
|
$43.10 / $37.46
|
|
|
|
|
|
NAVPS
()
|
-
|
|
Change
|
 - / -
- / -
|
Open / Close
(4/18/2024)
|
$41.02
/
$41.01
|
|
|
|
Management Fee
|
-
|
|
Traded Volume
|
8,764,747
|
|
Assets ($mil)
|
-
|
|
Rank (1Yr)
|
-
|
|
Std Dev (3Yr)
|
-
|
|
Beta (3Yr)
|
-
|
|
Volatility Ranking (3Yr)
|
-
|
|
RRSP Eligibility
|
Yes
|
|
Open to Invest
|
Open
|
|
Annual Dividend
|
$1.46
|
|
Annual Yield
|
3.55 %
|
|
|
Objective
Vanguard FTSE Emerging Markets ETF is an exchange-traded fund incorporated in the USA. The Fund seeks to track the performance of the FTSE Emerging Markets Index. The Fund invests its assets in the stocks that make up the Index holding each stock in the same proportion as its weighting.
|
Fund Manager
Data not available
Portfolio Manager
Data not available
Sub-Advisor
Data not available
|
|
Asset Allocation
(As of March 31, 2024)
|
Sector Allocation
(As of March 31, 2024)
|
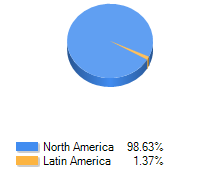
Geographic Allocation
(As of March 31, 2024)
|
Top 10 Holdings
| Name | Asset | Sector | Geographic | Percent |
| Taiwan Semiconductor Manufactrg Co Ltd - ADR | International Equity | Technology | Asia/Pacific Rim | 7.34% |
| Tencent Holdings Ltd | International Equity | Technology | Asia/Pacific Rim | 3.03% |
| Alibaba Group Holding Ltd - ADR | International Equity | Technology | Asia/Pacific Rim | 2.17% |
| Reliance Industries Ltd | International Equity | Energy | Other Asian | 1.63% |
| HDFC Bank Ltd - ADR | International Equity | Financial Services | Other Asian | 1.10% |
| Pinduoduo Inc - ADR | International Equity | Consumer Services | Asia/Pacific Rim | 1.05% |
| Infosys Ltd - ADR | International Equity | Technology | Other Asian | 0.97% |
| China Construction Bank Corp Cl H | International Equity | Financial Services | Asia/Pacific Rim | 0.80% |
| MediaTek Inc | International Equity | Technology | Asia/Pacific Rim | 0.75% |
| Meituan | International Equity | Technology | Asia/Pacific Rim | 0.75% |
Performance Data
(Data not available)
|
|
Return (%)
|
Annualized Return (%)
|
|
Return
|
1
Mth
|
3
Mth
|
6
Mth
|
YTD
|
1
Yr
|
3
Yr
|
5
Yr
|
10
Yr
|
|
Fund
|
-
|
-
|
-
|
-
|
-
|
-
|
-
|
-
|
|
Benchmark
|
1.39
|
2.08
|
9.00
|
2.08
|
8.78
|
-3.49
|
2.87
|
3.61
|
|
Quartile Ranking
|
-
|
-
|
-
|
-
|
-
|
-
|
-
|
-
|
|
Calendar Return (%)
|
2023
|
2022
|
2021
|
2020
|
2019
|
2018
|
2017
|
2016
|
2015
|
2014
|
|
Fund
|
-
|
-
|
-
|
-
|
-
|
-
|
-
|
-
|
-
|
-
|
|
Benchmark
|
9.61
|
-17.98
|
0.50
|
13.70
|
21.37
|
-13.61
|
35.33
|
11.18
|
-13.79
|
-0.43
|
|
Quartile Ranking
|
-
|
-
|
-
|
-
|
-
|
-
|
-
|
-
|
-
|
-
|