|
BMO International Dividend ETF (ZDI)
|
As of March 31, 2024
|
|
(International Equity)
|
|
Underlying Index
|
|
Inception Return
(11/5/2014)
|
6.62 %
|
|
Day High/Low
|
$23.17 / $23.00
|
|
YTD Return
|
7.03 %
|
|
52Week High/Low
|
$23.88 / $20.68
|
|
|
|
|
|
NAVPS
(4/18/2024)
|
$23.03
|
|
Change
|
 $-0.01 / -0.04 %
|
Open / Close
(4/18/2024)
|
$23.14
/
$23.01
|
|
|
|
Management Fee
|
0.40 %
|
|
Traded Volume
|
6,847
|
|
Assets ($mil)
|
-
|
|
Rank (1Yr)
|
166/742
|
|
Std Dev (3Yr)
|
15.90 %
|
|
Beta (3Yr)
|
1.12
|
|
Volatility Ranking (3Yr)
|
6/10
|
|
RRSP Eligibility
|
Yes
|
|
Open to Invest
|
Open
|
|
Annual Dividend
|
$0.96
|
|
Annual Yield
|
4.17 %
|
|
|
Objective
BMO International Dividend ETF has been designed to provide exposure to a yield weighted portfolio of dividend equities domiciled in international developed markets (outside North America).
|
Fund Manager
BMO Asset Management Inc.
Portfolio Manager
BMO Asset Management Inc.
Sub-Advisor
Data not available
|
|
Asset Allocation
(As of March 31, 2024)
|
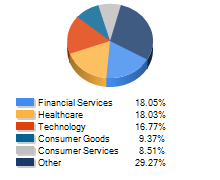
Sector Allocation
(As of March 31, 2024)
|
Geographic Allocation
(As of March 31, 2024)
|
Top 10 Holdings
| Name | Asset | Sector | Geographic | Percent |
| Toyota Motor Corp | International Equity | Consumer Goods | Japan | 2.94% |
| TotalEnergies SE | International Equity | Energy | European Union | 2.51% |
| LVMH Moet Hennessy Louis Vuitton SE | International Equity | Consumer Goods | European Union | 2.47% |
| Novo Nordisk A/S Cl B | International Equity | Healthcare | European Union | 2.37% |
| Allianz SE | International Equity | Financial Services | European Union | 2.35% |
| Roche Holding AG - Partcptn | International Equity | Healthcare | Other European | 2.26% |
| Novartis AG Cl N | International Equity | Healthcare | Other European | 2.25% |
| Nestle SA Cl N | International Equity | Consumer Goods | Other European | 2.16% |
| BHP Group Ltd | International Equity | Basic Materials | Asia/Pacific Rim | 2.15% |
| Rio Tinto PLC | International Equity | Basic Materials | European Union | 2.15% |
Performance Data
(As of March 31, 2024)
|
|
Return (%)
|
Annualized Return (%)
|
|
Return
|
1
Mth
|
3
Mth
|
6
Mth
|
YTD
|
1
Yr
|
3
Yr
|
5
Yr
|
10
Yr
|
|
Fund
|
2.84
|
7.03
|
14.16
|
7.03
|
15.82
|
10.64
|
7.20
|
-
|
|
Benchmark
|
3.12
|
7.59
|
16.68
|
7.59
|
15.23
|
5.89
|
7.22
|
6.93
|
|
Quartile Ranking
|
3
|
3
|
3
|
3
|
1
|
1
|
2
|
-
|
|
Calendar Return (%)
|
2023
|
2022
|
2021
|
2020
|
2019
|
2018
|
2017
|
2016
|
2015
|
2014
|
|
Fund
|
16.51
|
1.00
|
12.16
|
-5.62
|
13.01
|
-6.24
|
15.20
|
5.63
|
8.85
|
-
|
|
Benchmark
|
15.74
|
-10.67
|
8.97
|
8.01
|
16.27
|
-6.81
|
18.37
|
-1.70
|
19.41
|
4.12
|
|
Quartile Ranking
|
1
|
1
|
1
|
4
|
4
|
2
|
3
|
1
|
4
|
-
|