|
BMO International Dividend Hedged to CAD ETF (ZDH)
|
As of March 31, 2024
|
|
(International Equity)
|
|
FundGrade A+
® Rating recipient
For more information about FundGrade
click here
Underlying Index
|
|
Inception Return
(9/2/2015)
|
8.62 %
|
|
Day High/Low
|
$26.65 / $26.64
|
|
YTD Return
|
9.13 %
|
|
52Week High/Low
|
$27.35 / $23.46
|
|
|
|
|
|
NAVPS
(4/18/2024)
|
$26.52
|
|
Change
|
 $0.05 / 0.20 %
|
Open / Close
(4/18/2024)
|
$26.64
/
$26.65
|
|
|
|
Management Fee
|
0.40 %
|
|
Traded Volume
|
300
|
|
Assets ($mil)
|
-
|
|
Rank (1Yr)
|
43/742
|
|
Std Dev (3Yr)
|
17.82 %
|
|
Beta (3Yr)
|
1.19
|
|
Volatility Ranking (3Yr)
|
6/10
|
|
RRSP Eligibility
|
Yes
|
|
Open to Invest
|
Open
|
|
Annual Dividend
|
$1.08
|
|
Annual Yield
|
4.05 %
|
|
|
Objective
The fund seeks to provide unitholders with exposure to the performance of a yield weighted portfolio of high dividend paying equities of international companies to provide long-term appreciation and to generate income. Eligible securities will be selected using a rules based methodology that considers dividend growth, yield, and payout ratio, and eligibility will be reviewed annually. Securities will also be subject to a screening process to ensure sufficient liquidity.
|
Fund Manager
BMO Asset Management Inc.
Portfolio Manager
BMO Asset Management Inc.
Sub-Advisor
Data not available
|
|
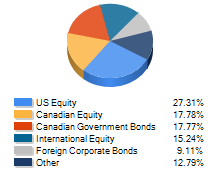
Asset Allocation
(As of March 31, 2024)
|
Sector Allocation
(As of March 31, 2024)
|
Geographic Allocation
(As of March 31, 2024)
|
Top 10 Holdings
| Name | Asset | Sector | Geographic | Percent |
| BMO International Dividend ETF (ZDI) | International Equity | Exchange Traded Fund | Multi-National | 98.87% |
| CAD Currency Forward | Cash and Equivalents | Cash and Cash Equivalent | Canada | 1.33% |
| CANADIAN DOLLAR | Cash and Equivalents | Cash and Cash Equivalent | Canada | 0.05% |
| CHF Currency Forward | Cash and Equivalents | Cash and Cash Equivalent | Other European | 0.00% |
| USD Currency Forward | Cash and Equivalents | Cash and Cash Equivalent | United States | 0.00% |
| AUD Currency Forward | Cash and Equivalents | Cash and Cash Equivalent | Asia/Pacific Rim | 0.00% |
| SGD Currency Forward | Cash and Equivalents | Cash and Cash Equivalent | Asia/Pacific Rim | 0.00% |
| HKD Currency Forward | Cash and Equivalents | Cash and Cash Equivalent | Asia/Pacific Rim | -0.01% |
| DKK Currency Forward | Cash and Equivalents | Cash and Cash Equivalent | European Union | -0.01% |
| SEK Currency Forward | Cash and Equivalents | Cash and Cash Equivalent | European Union | -0.01% |
Performance Data
(As of March 31, 2024)
|
|
Return (%)
|
Annualized Return (%)
|
|
Return
|
1
Mth
|
3
Mth
|
6
Mth
|
YTD
|
1
Yr
|
3
Yr
|
5
Yr
|
10
Yr
|
|
Fund
|
3.76
|
9.13
|
13.88
|
9.13
|
19.95
|
13.28
|
9.49
|
-
|
|
Benchmark
|
3.12
|
7.59
|
16.68
|
7.59
|
15.23
|
5.89
|
7.22
|
6.93
|
|
Quartile Ranking
|
1
|
1
|
3
|
1
|
1
|
1
|
1
|
-
|
|
Calendar Return (%)
|
2023
|
2022
|
2021
|
2020
|
2019
|
2018
|
2017
|
2016
|
2015
|
2014
|
|
Fund
|
18.62
|
2.82
|
19.27
|
-9.57
|
20.26
|
-8.87
|
12.99
|
15.36
|
-
|
-
|
|
Benchmark
|
15.74
|
-10.67
|
8.97
|
8.01
|
16.27
|
-6.81
|
18.37
|
-1.70
|
19.41
|
4.12
|
|
Quartile Ranking
|
1
|
1
|
1
|
4
|
2
|
3
|
4
|
1
|
-
|
-
|