|
BMO Low Volatility Emerging Markets Equ ETF (ZLE)
|
As of March 31, 2024
|
|
(Emerging Markets Equity)
|
|
Underlying Index
|
|
Inception Return
(5/17/2016)
|
0.70 %
|
|
Day High/Low
|
$17.33 / $17.28
|
|
YTD Return
|
2.94 %
|
|
52Week High/Low
|
$17.87 / $16.01
|
|
|
|
|
|
NAVPS
(4/19/2024)
|
$17.29
|
|
Change
|
 $-0.15 / -0.84 %
|
Open / Close
(4/19/2024)
|
$17.33
/
$17.38
|
|
|
|
Management Fee
|
0.45 %
|
|
Traded Volume
|
18,600
|
|
Assets ($mil)
|
$70.02
|
|
Rank (1Yr)
|
201/313
|
|
Std Dev (3Yr)
|
12.30 %
|
|
Beta (3Yr)
|
0.84
|
|
Volatility Ranking (3Yr)
|
6/10
|
|
RRSP Eligibility
|
Yes
|
|
Open to Invest
|
Open
|
|
Annual Dividend
|
$0.60
|
|
Annual Yield
|
3.45 %
|
|
|
Objective
BMO Low Volatility Emerging Markets Equity ETF seeks to provide Unitholders with exposure to the performance of a portfolio of emerging market stocks with the potential for long-term capital appreciation. Securities will be selected from the large capitalization emerging market equity universe. The securities that have lower sensitivity to market movement (beta) will be selected for the portfolio and it will be weighted so that a higher allocation is given to securities with lower beta.
|
Fund Manager
BMO Asset Management Inc.
Portfolio Manager
BMO Asset Management Inc.
Sub-Advisor
Data not available
|
|
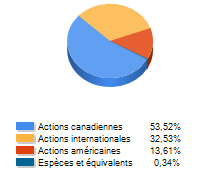
Asset Allocation
(As of March 31, 2024)
|
Sector Allocation
(As of March 31, 2024)
|
Geographic Allocation
(As of March 31, 2024)
|
Top 10 Holdings
| Name | Asset | Sector | Geographic | Percent |
| Tencent Holdings Ltd | International Equity | Technology | Asia/Pacific Rim | 2.40% |
| Saudi Telecom Co SJSC | International Equity | Telecommunications | Africa and Middle East | 1.79% |
| Bank of China Ltd Cl H | International Equity | Financial Services | Asia/Pacific Rim | 1.72% |
| Chunghwa Telecom Co Ltd | International Equity | Telecommunications | Asia/Pacific Rim | 1.59% |
| Samsung Electronics Co Ltd | International Equity | Technology | Other Asian | 1.57% |
| First Financial Holding Co Ltd | International Equity | Financial Services | Asia/Pacific Rim | 1.41% |
| Taiwan Semiconductor Manufactrg Co Ltd | International Equity | Technology | Asia/Pacific Rim | 1.39% |
| Alibaba Group Holding Ltd | International Equity | Technology | Asia/Pacific Rim | 1.26% |
| Taiwan Cooperative Financl Hldg Co Ltd | International Equity | Financial Services | Asia/Pacific Rim | 1.16% |
| Sun Pharmaceutical Industries Ltd | International Equity | Healthcare | Other Asian | 1.11% |
Performance Data
(As of March 31, 2024)
|
|
Return (%)
|
Annualized Return (%)
|
|
Return
|
1
Mth
|
3
Mth
|
6
Mth
|
YTD
|
1
Yr
|
3
Yr
|
5
Yr
|
10
Yr
|
|
Fund
|
-0.12
|
2.94
|
7.02
|
2.94
|
7.28
|
-2.43
|
-1.58
|
-
|
|
Benchmark
|
1.24
|
4.58
|
9.24
|
4.58
|
8.92
|
-1.06
|
3.16
|
5.74
|
|
Quartile Ranking
|
4
|
4
|
4
|
4
|
3
|
2
|
4
|
-
|
|
Calendar Return (%)
|
2023
|
2022
|
2021
|
2020
|
2019
|
2018
|
2017
|
2016
|
2015
|
2014
|
|
Fund
|
7.70
|
-11.83
|
-8.06
|
0.35
|
7.92
|
-5.46
|
14.82
|
-
|
-
|
-
|
|
Benchmark
|
7.03
|
-12.38
|
0.08
|
11.45
|
15.55
|
-6.05
|
26.42
|
7.90
|
2.69
|
8.76
|
|
Quartile Ranking
|
3
|
1
|
4
|
4
|
4
|
1
|
4
|
-
|
-
|
-
|