|
AGF Systematic Canadian Equity ETF (QCD)
|
As of March 31, 2024
|
|
(Canadian Equity)
|
|
Underlying Index
|
|
Inception Return
(1/30/2017)
|
7.15 %
|
|
Day High/Low
|
- / -
|
|
YTD Return
|
5.52 %
|
|
52Week High/Low
|
$34.22 / $29.33
|
|
|
|
|
|
NAVPS
(4/24/2024)
|
$33.51
|
|
Change
|
 $-0.24 / -0.70 %
|
Open / Close
(4/24/2024)
|
-
/
$33.54
|
|
|
|
Management Fee
|
0.45 %
|
|
Traded Volume
|
0
|
|
Assets ($mil)
|
-
|
|
Rank (1Yr)
|
569/704
|
|
Std Dev (3Yr)
|
16.04 %
|
|
Beta (3Yr)
|
1.01
|
|
Volatility Ranking (3Yr)
|
7/10
|
|
RRSP Eligibility
|
Yes
|
|
Open to Invest
|
Open
|
|
Annual Dividend
|
$1.22
|
|
Annual Yield
|
3.64 %
|
|
|
Objective
AGF Systematic Canadian Equity ETF seeks to provide long-term capital appreciation with reduced volatility, over a full market cycle, by investing primarily in equity securities of issuers in Canada.
|
Fund Manager
AGF Investments Inc.
Portfolio Manager
AGF Investments Inc.
Sub-Advisor
Data not available
|
|
Asset Allocation
(As of March 31, 2024)
|
Sector Allocation
(As of March 31, 2024)
|
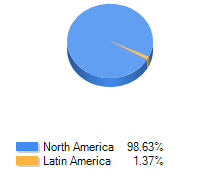
Geographic Allocation
(As of March 31, 2024)
|
Top 10 Holdings
| Name | Asset | Sector | Geographic | Percent |
| Royal Bank of Canada | Canadian Equity | Financial Services | Canada | 7.29% |
| Canadian Pacific Kansas City Ltd | Canadian Equity | Industrial Services | Canada | 4.80% |
| Bank of Montreal | Canadian Equity | Financial Services | Canada | 4.17% |
| Canadian National Railway Co | Canadian Equity | Industrial Services | Canada | 4.01% |
| Toronto-Dominion Bank | Canadian Equity | Financial Services | Canada | 3.89% |
| Constellation Software Inc | Canadian Equity | Technology | Canada | 3.57% |
| Suncor Energy Inc | Canadian Equity | Energy | Canada | 3.33% |
| Waste Connections Inc | Canadian Equity | Industrial Services | Canada | 3.01% |
| Shopify Inc Cl A | Canadian Equity | Technology | Canada | 3.00% |
| Alimentation Couche-Tard Inc | Canadian Equity | Consumer Services | Canada | 2.62% |
Performance Data
(As of March 31, 2024)
|
|
Return (%)
|
Annualized Return (%)
|
|
Return
|
1
Mth
|
3
Mth
|
6
Mth
|
YTD
|
1
Yr
|
3
Yr
|
5
Yr
|
10
Yr
|
|
Fund
|
3.62
|
5.52
|
12.72
|
5.52
|
9.94
|
7.93
|
8.44
|
-
|
|
Benchmark
|
4.14
|
6.62
|
15.26
|
6.62
|
13.96
|
9.11
|
9.96
|
7.67
|
|
Quartile Ranking
|
2
|
4
|
4
|
4
|
4
|
3
|
3
|
-
|
|
Calendar Return (%)
|
2023
|
2022
|
2021
|
2020
|
2019
|
2018
|
2017
|
2016
|
2015
|
2014
|
|
Fund
|
8.91
|
-6.15
|
25.46
|
3.25
|
19.97
|
-9.08
|
-
|
-
|
-
|
-
|
|
Benchmark
|
11.75
|
-5.84
|
25.09
|
5.60
|
22.88
|
-8.89
|
9.10
|
21.08
|
-8.32
|
10.55
|
|
Quartile Ranking
|
3
|
3
|
2
|
3
|
3
|
2
|
-
|
-
|
-
|
-
|