|
AGF Systematic International Equity ETF (QIE)
|
As of March 31, 2024
|
|
(International Equity)
|
|
Underlying Index
|
|
Inception Return
(1/30/2017)
|
6.51 %
|
|
Day High/Low
|
$31.68 / $31.68
|
|
YTD Return
|
7.13 %
|
|
52Week High/Low
|
$32.95 / $26.76
|
|
|
|
|
|
NAVPS
(4/24/2024)
|
$31.73
|
|
Change
|
 $0.09 / 0.29 %
|
Open / Close
(4/24/2024)
|
$31.68
/
$31.68
|
|
|
|
Management Fee
|
0.45 %
|
|
Traded Volume
|
200
|
|
Assets ($mil)
|
-
|
|
Rank (1Yr)
|
183/742
|
|
Std Dev (3Yr)
|
11.12 %
|
|
Beta (3Yr)
|
0.83
|
|
Volatility Ranking (3Yr)
|
6/10
|
|
RRSP Eligibility
|
Yes
|
|
Open to Invest
|
Open
|
|
Annual Dividend
|
$0.84
|
|
Annual Yield
|
2.66 %
|
|
|
Objective
AGF Systematic International Equity ETF seeks to provide long-term capital appreciation with reduced volatility, over a full market cycle, by investing primarily in equity securities of issuers in Europe, Australasia and the Far East.
|
Fund Manager
AGF Investments Inc.
Portfolio Manager
Robert Yan, AGF Investments Inc.
Grant Wang, AGF Investments Inc.
Lei Wan, AGF Investments Inc.
Sub-Advisor
Data not available
|
|
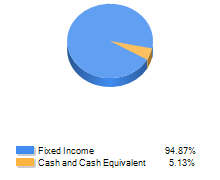
Asset Allocation
(As of March 31, 2024)
|
Sector Allocation
(As of March 31, 2024)
|
Geographic Allocation
(As of March 31, 2024)
|
Top 10 Holdings
| Name | Asset | Sector | Geographic | Percent |
| Novo Nordisk A/S Cl B | International Equity | Healthcare | European Union | 3.26% |
| ASML Holding NV | International Equity | Technology | European Union | 2.68% |
| Shell PLC | International Equity | Energy | European Union | 2.10% |
| AstraZeneca PLC | International Equity | Healthcare | European Union | 1.88% |
| Sap SE | International Equity | Technology | European Union | 1.87% |
| LVMH Moet Hennessy Louis Vuitton SE | International Equity | Consumer Goods | European Union | 1.85% |
| Cash and Cash Equivalents | Cash and Equivalents | Cash and Cash Equivalent | Canada | 1.82% |
| BNP Paribas SA | International Equity | Financial Services | European Union | 1.74% |
| Siemens AG Cl N | International Equity | Industrial Goods | European Union | 1.63% |
| BHP Group Ltd | International Equity | Basic Materials | Asia/Pacific Rim | 1.53% |
Performance Data
(As of March 31, 2024)
|
|
Return (%)
|
Annualized Return (%)
|
|
Return
|
1
Mth
|
3
Mth
|
6
Mth
|
YTD
|
1
Yr
|
3
Yr
|
5
Yr
|
10
Yr
|
|
Fund
|
3.04
|
7.13
|
16.34
|
7.13
|
15.52
|
6.86
|
5.69
|
-
|
|
Benchmark
|
3.12
|
7.59
|
16.68
|
7.59
|
15.23
|
5.89
|
7.22
|
6.93
|
|
Quartile Ranking
|
2
|
3
|
2
|
3
|
1
|
2
|
3
|
-
|
|
Calendar Return (%)
|
2023
|
2022
|
2021
|
2020
|
2019
|
2018
|
2017
|
2016
|
2015
|
2014
|
|
Fund
|
14.56
|
-9.28
|
11.36
|
1.11
|
11.97
|
-3.26
|
-
|
-
|
-
|
-
|
|
Benchmark
|
15.74
|
-10.67
|
8.97
|
8.01
|
16.27
|
-6.81
|
18.37
|
-1.70
|
19.41
|
4.12
|
|
Quartile Ranking
|
2
|
2
|
2
|
3
|
4
|
1
|
-
|
-
|
-
|
-
|