|
AGF Systematic US Equity ETF (QUS)
|
As of March 31, 2024
|
|
(U.S. Equity)
|
|
Underlying Index
|
|
Inception Return
(1/30/2017)
|
11.84 %
|
|
Day High/Low
|
$50.23 / $49.86
|
|
YTD Return
|
12.13 %
|
|
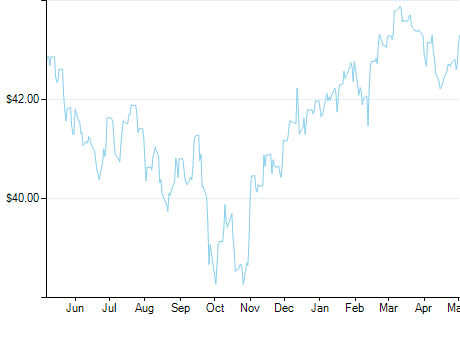
52Week High/Low
|
$51.71 / $40.58
|
|
|
|
|
|
NAVPS
(4/25/2024)
|
$50.21
|
|
Change
|
 $-0.35 / -0.70 %
|
Open / Close
(4/25/2024)
|
$49.98
/
$50.23
|
|
|
|
Management Fee
|
0.45 %
|
|
Traded Volume
|
2,500
|
|
Assets ($mil)
|
-
|
|
Rank (1Yr)
|
758/1288
|
|
Std Dev (3Yr)
|
14.02 %
|
|
Beta (3Yr)
|
1.01
|
|
Volatility Ranking (3Yr)
|
7/10
|
|
RRSP Eligibility
|
Yes
|
|
Open to Invest
|
Open
|
|
Annual Dividend
|
$0.47
|
|
Annual Yield
|
0.93 %
|
|
|
Objective
AGF Systematic US Equity ETF seeks to provide long-term capital appreciation with reduced volatility, over a full market cycle, by investing primarily in equity securities of issuers in the United States.
|
Fund Manager
AGF Investments Inc.
Portfolio Manager
Robert Yan, AGF Investments Inc.
Sub-Advisor
Data not available
|
|
Asset Allocation
(As of March 31, 2024)
|
Sector Allocation
(As of March 31, 2024)
|
Geographic Allocation
(As of March 31, 2024)
|
Top 10 Holdings
| Name | Asset | Sector | Geographic | Percent |
| Apple Inc | US Equity | Technology | United States | 6.45% |
| Microsoft Corp | US Equity | Technology | United States | 6.38% |
| NVIDIA Corp | US Equity | Technology | United States | 4.39% |
| Alphabet Inc Cl A | US Equity | Technology | United States | 2.86% |
| Amazon.com Inc | US Equity | Consumer Services | United States | 2.85% |
| Alphabet Inc Cl C | US Equity | Technology | United States | 2.64% |
| Meta Platforms Inc Cl A | US Equity | Technology | United States | 2.46% |
| Exxon Mobil Corp | US Equity | Energy | United States | 1.91% |
| UnitedHealth Group Inc | US Equity | Healthcare | United States | 1.90% |
| Mastercard Inc Cl A | US Equity | Financial Services | United States | 1.79% |
Performance Data
(As of March 31, 2024)
|
|
Return (%)
|
Annualized Return (%)
|
|
Return
|
1
Mth
|
3
Mth
|
6
Mth
|
YTD
|
1
Yr
|
3
Yr
|
5
Yr
|
10
Yr
|
|
Fund
|
2.91
|
12.13
|
21.14
|
12.13
|
26.88
|
10.96
|
12.13
|
-
|
|
Benchmark
|
3.07
|
13.26
|
23.76
|
13.26
|
30.04
|
14.30
|
15.37
|
15.28
|
|
Quartile Ranking
|
2
|
3
|
3
|
3
|
3
|
2
|
3
|
-
|
|
Calendar Return (%)
|
2023
|
2022
|
2021
|
2020
|
2019
|
2018
|
2017
|
2016
|
2015
|
2014
|
|
Fund
|
17.74
|
-12.97
|
24.98
|
11.46
|
23.05
|
1.21
|
-
|
-
|
-
|
-
|
|
Benchmark
|
23.32
|
-12.52
|
28.16
|
16.07
|
25.18
|
3.98
|
13.80
|
8.65
|
20.77
|
24.19
|
|
Quartile Ranking
|
3
|
2
|
2
|
3
|
3
|
2
|
-
|
-
|
-
|
-
|