|
BMO Global Consumer Discret Hgd CAD Idx ETF (DISC)
|
As of March 31, 2024
|
|
(Global Equity)
|
|
Underlying Index
|
FTSE Developed ex Korea Consumer Discretionary Capped 100% Hedged to CAD Index
|
Inception Return
(4/3/2017)
|
11.14 %
|
|
Day High/Low
|
$36.39 / $36.12
|
|
YTD Return
|
8.93 %
|
|
52Week High/Low
|
$38.80 / $30.34
|
|
|
|
|
|
NAVPS
(4/19/2024)
|
$36.11
|
|
Change
|
 $-0.35 / -0.97 %
|
Open / Close
(4/19/2024)
|
$36.39
/
$36.12
|
|
|
|
Management Fee
|
0.35 %
|
|
Traded Volume
|
2,111
|
|
Assets ($mil)
|
$33.51
|
|
Rank (1Yr)
|
378/1934
|
|
Std Dev (3Yr)
|
19.41 %
|
|
Beta (3Yr)
|
1.40
|
|
Volatility Ranking (3Yr)
|
10/10
|
|
RRSP Eligibility
|
Yes
|
|
Open to Invest
|
Open
|
|
Annual Dividend
|
$0.36
|
|
Annual Yield
|
1.00 %
|
|
|
Objective
BMO Global Consumer Discretionary Hedged to CAD Index ETF seeks to replicate, to the extent possible, the performance of a global consumer discretionary index, net of expenses. Currently, BMO Global Consumer Discretionary Hedged to CAD Index ETF seeks to replicate the performance of the Russell Developed Large Cap Consumer Discretionary Capped 100% Hedged to CAD Index.
|
Fund Manager
BMO Asset Management Inc.
Portfolio Manager
BMO Asset Management Inc.
Sub-Advisor
Data not available
|
|
Asset Allocation
(As of March 31, 2024)
|
Sector Allocation
(As of March 31, 2024)
|
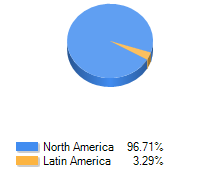
Geographic Allocation
(As of March 31, 2024)
|
Top 10 Holdings
| Name | Asset | Sector | Geographic | Percent |
| Amazon.com Inc | US Equity | Consumer Services | United States | 10.07% |
| Tesla Inc | US Equity | Consumer Goods | United States | 5.73% |
| Home Depot Inc | US Equity | Consumer Services | United States | 4.51% |
| Costco Wholesale Corp | US Equity | Consumer Services | United States | 3.81% |
| Toyota Motor Corp | International Equity | Consumer Goods | Japan | 3.53% |
| Netflix Inc | US Equity | Consumer Services | United States | 3.05% |
| Walmart Inc | US Equity | Consumer Services | United States | 3.03% |
| LVMH Moet Hennessy Louis Vuitton SE | International Equity | Consumer Goods | European Union | 2.64% |
| Walt Disney Co | US Equity | Telecommunications | United States | 2.63% |
| Mcdonald's Corp | US Equity | Consumer Services | United States | 2.41% |
Performance Data
(As of March 31, 2024)
|
|
Return (%)
|
Annualized Return (%)
|
|
Return
|
1
Mth
|
3
Mth
|
6
Mth
|
YTD
|
1
Yr
|
3
Yr
|
5
Yr
|
10
Yr
|
|
Fund
|
1.01
|
8.93
|
19.08
|
8.93
|
24.28
|
5.54
|
11.93
|
-
|
|
Benchmark
|
2.94
|
10.27
|
20.07
|
10.27
|
23.05
|
9.29
|
11.08
|
10.93
|
|
Quartile Ranking
|
4
|
3
|
2
|
3
|
1
|
4
|
1
|
-
|
|
Calendar Return (%)
|
2023
|
2022
|
2021
|
2020
|
2019
|
2018
|
2017
|
2016
|
2015
|
2014
|
|
Fund
|
31.09
|
-26.87
|
18.13
|
26.87
|
25.21
|
-6.06
|
-
|
-
|
-
|
-
|
|
Benchmark
|
19.37
|
-12.64
|
17.62
|
13.15
|
21.41
|
-1.79
|
16.29
|
5.18
|
16.88
|
13.97
|
|
Quartile Ranking
|
1
|
4
|
2
|
1
|
1
|
3
|
-
|
-
|
-
|
-
|