|
BMO Global Consumer Staples Hgd CAD Idx ETF (STPL)
|
As of March 31, 2024
|
|
(Sector Equity)
|
|
Underlying Index
|
FTSE Developed ex Korea Consumer Staples Capped 100% Hedged to CAD Index
|
Inception Return
(4/3/2017)
|
4.76 %
|
|
Day High/Low
|
$23.58 / $23.43
|
|
YTD Return
|
4.15 %
|
|
52Week High/Low
|
$25.24 / $21.79
|
|
|
|
|
|
NAVPS
(4/24/2024)
|
$23.58
|
|
Change
|
 $0.14 / 0.61 %
|
Open / Close
(4/24/2024)
|
$23.43
/
$23.58
|
|
|
|
Management Fee
|
0.35 %
|
|
Traded Volume
|
1,332
|
|
Assets ($mil)
|
$36.57
|
|
Rank (1Yr)
|
156/177
|
|
Std Dev (3Yr)
|
11.91 %
|
|
Beta (3Yr)
|
0.54
|
|
Volatility Ranking (3Yr)
|
5/10
|
|
RRSP Eligibility
|
Yes
|
|
Open to Invest
|
Open
|
|
Annual Dividend
|
$0.56
|
|
Annual Yield
|
2.37 %
|
|
|
Objective
BMO Global Consumer Staples Hedged to CAD Index ETF seeks to replicate, to the extent possible, the performance of a global consumer staples index, net of expenses. Currently, BMO Global Consumer Staples Hedged to CAD Index ETF seeks to replicate the performance of the Russell Developed Large Cap Consumer Staples Capped 100% Hedged to CAD Index.
|
Fund Manager
BMO Asset Management Inc.
Portfolio Manager
BMO Asset Management Inc.
Sub-Advisor
Data not available
|
|
Asset Allocation
(As of March 31, 2024)
|
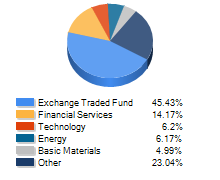
Sector Allocation
(As of March 31, 2024)
|
Geographic Allocation
(As of March 31, 2024)
|
Top 10 Holdings
| Name | Asset | Sector | Geographic | Percent |
| Procter & Gamble Co | US Equity | Consumer Goods | United States | 9.88% |
| Nestle SA Cl N | International Equity | Consumer Goods | Other European | 8.06% |
| PepsiCo Inc | US Equity | Consumer Goods | United States | 6.82% |
| Coca-Cola Co | US Equity | Consumer Goods | United States | 6.75% |
| Philip Morris International Inc | US Equity | Consumer Goods | United States | 4.02% |
| Unilever PLC | International Equity | Consumer Goods | European Union | 3.52% |
| CVS Health Corp | US Equity | Healthcare | United States | 2.88% |
| Mondelez International Inc Cl A | US Equity | Consumer Goods | United States | 2.68% |
| Diageo PLC | International Equity | Consumer Goods | European Union | 2.30% |
| Altria Group Inc | US Equity | Consumer Goods | United States | 2.20% |
Performance Data
(As of March 31, 2024)
|
|
Return (%)
|
Annualized Return (%)
|
|
Return
|
1
Mth
|
3
Mth
|
6
Mth
|
YTD
|
1
Yr
|
3
Yr
|
5
Yr
|
10
Yr
|
|
Fund
|
3.01
|
4.15
|
5.88
|
4.15
|
0.64
|
4.60
|
5.44
|
-
|
|
Benchmark
|
4.14
|
6.62
|
15.26
|
6.62
|
13.96
|
9.11
|
9.96
|
7.67
|
|
Quartile Ranking
|
1
|
4
|
4
|
4
|
4
|
3
|
4
|
-
|
|
Calendar Return (%)
|
2023
|
2022
|
2021
|
2020
|
2019
|
2018
|
2017
|
2016
|
2015
|
2014
|
|
Fund
|
-2.34
|
-0.27
|
14.88
|
2.63
|
21.43
|
-9.10
|
-
|
-
|
-
|
-
|
|
Benchmark
|
11.75
|
-5.84
|
25.09
|
5.60
|
22.88
|
-8.89
|
9.10
|
21.08
|
-8.32
|
10.55
|
|
Quartile Ranking
|
4
|
1
|
3
|
4
|
3
|
4
|
-
|
-
|
-
|
-
|