|
BMO Covered Call US Banks ETF (ZWK)
|
As of March 31, 2024
|
|
(Financial Services Equity)
|
|
Underlying Index
|
|
Inception Return
(2/15/2019)
|
0.95 %
|
|
Day High/Low
|
$20.25 / $20.00
|
|
YTD Return
|
13.08 %
|
|
52Week High/Low
|
$21.03 / $15.60
|
|
|
|
|
|
NAVPS
(4/18/2024)
|
$20.11
|
|
Change
|
 $0.08 / 0.41 %
|
Open / Close
(4/18/2024)
|
$20.18
/
$20.11
|
|
|
|
Management Fee
|
0.65 %
|
|
Traded Volume
|
23,896
|
|
Assets ($mil)
|
-
|
|
Rank (1Yr)
|
19/71
|
|
Std Dev (3Yr)
|
26.58 %
|
|
Beta (3Yr)
|
1.42
|
|
Volatility Ranking (3Yr)
|
10/10
|
|
RRSP Eligibility
|
Yes
|
|
Open to Invest
|
Open
|
|
Annual Dividend
|
$1.90
|
|
Annual Yield
|
9.42 %
|
|
|
Objective
Seeks to provide exposure to the performance of a portfolio of US banks to generate income and provide long-term capital appreciation while mitigating downside risk through the use of covered call options.
|
Fund Manager
BMO Asset Management Inc.
Portfolio Manager
BMO Asset Management Inc.
Sub-Advisor
Data not available
|
|
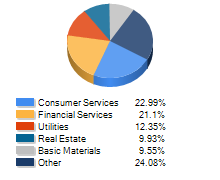
Asset Allocation
(As of March 31, 2024)
|
Sector Allocation
(As of March 31, 2024)
|
Geographic Allocation
(As of March 31, 2024)
|
Top 10 Holdings
| Name | Asset | Sector | Geographic | Percent |
| Regions Financial Corp | US Equity | Financial Services | United States | 6.65% |
| KeyCorp | US Equity | Financial Services | United States | 6.55% |
| Citizens Financial Group Inc | US Equity | Financial Services | United States | 6.54% |
| Truist Financial Corp | US Equity | Financial Services | United States | 6.53% |
| PNC Financial Services Group Inc | US Equity | Financial Services | United States | 6.50% |
| Citigroup Inc | US Equity | Financial Services | United States | 6.45% |
| Goldman Sachs Group Inc | US Equity | Financial Services | United States | 6.42% |
| Huntington Bancshares Inc | US Equity | Financial Services | United States | 6.38% |
| JPMorgan Chase & Co | US Equity | Financial Services | United States | 6.36% |
| Bank of America Corp | US Equity | Financial Services | United States | 6.35% |
Performance Data
(As of March 31, 2024)
|
|
Return (%)
|
Annualized Return (%)
|
|
Return
|
1
Mth
|
3
Mth
|
6
Mth
|
YTD
|
1
Yr
|
3
Yr
|
5
Yr
|
10
Yr
|
|
Fund
|
8.37
|
13.08
|
29.44
|
13.08
|
27.44
|
-2.95
|
2.07
|
-
|
|
Benchmark
|
3.76
|
9.87
|
21.36
|
9.87
|
25.68
|
9.79
|
8.54
|
8.93
|
|
Quartile Ranking
|
1
|
1
|
1
|
1
|
2
|
4
|
4
|
-
|
|
Calendar Return (%)
|
2023
|
2022
|
2021
|
2020
|
2019
|
2018
|
2017
|
2016
|
2015
|
2014
|
|
Fund
|
-15.34
|
-17.42
|
37.17
|
-13.92
|
-
|
-
|
-
|
-
|
-
|
-
|
|
Benchmark
|
13.41
|
-5.68
|
22.05
|
-5.24
|
19.43
|
-4.99
|
15.24
|
6.34
|
14.20
|
14.35
|
|
Quartile Ranking
|
4
|
4
|
1
|
4
|
-
|
-
|
-
|
-
|
-
|
-
|