|
Accelerate Arbitrage Fund (ARB)
|
As of March 31, 2024
|
|
(Alternative Equity Focused)
|
|
Underlying Index
|
|
Inception Return
(4/6/2020)
|
10.26 %
|
|
Day High/Low
|
$26.25 / $26.25
|
|
YTD Return
|
3.17 %
|
|
52Week High/Low
|
$26.50 / $24.47
|
|
|
|
|
|
NAVPS
(4/10/2024)
|
$26.30
|
|
Change
|
 $0.00 / -0.02 %
|
Open / Close
(4/26/2024)
|
$26.25
/
$26.20
|
|
|
|
Management Fee
|
0.95 %
|
|
Traded Volume
|
201
|
|
Assets ($mil)
|
$27.61
|
|
Rank (1Yr)
|
105/151
|
|
Std Dev (3Yr)
|
-
|
|
Beta (3Yr)
|
-
|
|
Volatility Ranking (3Yr)
|
1/10
|
|
RRSP Eligibility
|
Yes
|
|
Open to Invest
|
Open
|
|
Annual Dividend
|
$0.98
|
|
Annual Yield
|
3.74 %
|
|
|
Objective
Accelerate Arbitrage Fund seeks to achieve long-term capital appreciation and a superior risk-adjusted return relative to the S&P Merger Arbitrage Index.
|
Fund Manager
Accelerate Financial Technologies Inc.
Portfolio Manager
Julian Klymochko, Accelerate Financial Technologies Inc.
Sub-Advisor
Data not available
|
|
Asset Allocation
(As of March 31, 2024)
|
Sector Allocation
(As of March 31, 2024)
|
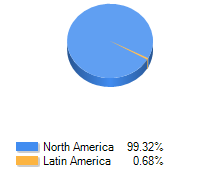
Geographic Allocation
(As of March 31, 2024)
|
Top 10 Holdings
| Name | Asset | Sector | Geographic | Percent |
| Everbridge Inc | US Equity | Technology | United States | 5.10% |
| Jaws Mustang Acquisition Corp Cl A | US Equity | Other | United States | 4.28% |
| Hess Corp | US Equity | Energy | United States | 3.79% |
| Carrols Restaurant Group Inc | US Equity | Consumer Services | United States | 3.70% |
| Tricon Residential Inc | Canadian Equity | Real Estate | Canada | 3.65% |
| Masonite International Corp | US Equity | Real Estate | United States | 3.19% |
| Atlantic Coastal Acquisition Corp II Cl A | US Equity | Other | United States | 3.06% |
| Fortune Rise Acquisition Corp Cl A | US Equity | Other | United States | 3.03% |
| Osiris Acquisition Corp Cl A | US Equity | Other | United States | 2.97% |
| Northern Star Investment Corp IV Cl A | US Equity | Other | United States | 2.95% |
Performance Data
(As of March 31, 2024)
|
|
Return (%)
|
Annualized Return (%)
|
|
Return
|
1
Mth
|
3
Mth
|
6
Mth
|
YTD
|
1
Yr
|
3
Yr
|
5
Yr
|
10
Yr
|
|
Fund
|
1.79
|
3.17
|
3.91
|
3.17
|
6.58
|
2.12
|
-
|
-
|
|
Benchmark
|
4.14
|
6.62
|
15.26
|
6.62
|
13.96
|
9.11
|
9.96
|
7.67
|
|
Quartile Ranking
|
3
|
4
|
4
|
4
|
3
|
4
|
-
|
-
|
|
Calendar Return (%)
|
2023
|
2022
|
2021
|
2020
|
2019
|
2018
|
2017
|
2016
|
2015
|
2014
|
|
Fund
|
4.04
|
-1.48
|
7.42
|
-
|
-
|
-
|
-
|
-
|
-
|
-
|
|
Benchmark
|
11.75
|
-5.84
|
25.09
|
5.60
|
22.88
|
-8.89
|
9.10
|
21.08
|
-8.32
|
10.55
|
|
Quartile Ranking
|
3
|
2
|
4
|
-
|
-
|
-
|
-
|
-
|
-
|
-
|