|
AGF Global Sustainable Growth Equity ETF (AGSG)
|
As of March 31, 2024
|
|
(Global Equity)
|
|
Underlying Index
|
|
Inception Return
(10/2/2020)
|
4.53 %
|
|
Day High/Low
|
$28.15 / $27.96
|
|
YTD Return
|
6.67 %
|
|
52Week High/Low
|
$28.90 / $23.34
|
|
|
|
|
|
NAVPS
(4/26/2024)
|
$28.26
|
|
Change
|
 $0.43 / 1.53 %
|
Open / Close
(4/26/2024)
|
$27.96
/
$28.30
|
|
|
|
Management Fee
|
0.65 %
|
|
Traded Volume
|
2,200
|
|
Assets ($mil)
|
-
|
|
Rank (1Yr)
|
1893/1936
|
|
Std Dev (3Yr)
|
-
|
|
Beta (3Yr)
|
-
|
|
Volatility Ranking (3Yr)
|
10/10
|
|
RRSP Eligibility
|
Yes
|
|
Open to Invest
|
Open
|
|
Annual Dividend
|
$0.26
|
|
Annual Yield
|
0.90 %
|
|
|
Objective
AGF Global Sustainable Growth Equity ETF seeks to provide long-term capital appreciation by investing primarily in a diversified portfolio of equity securities, globally, which fit its concept of sustainable development.
|
Fund Manager
AGF Investments Inc.
Portfolio Manager
Vishal Bane, AGF Investments Inc.
Sub-Advisor
Data not available
|
|
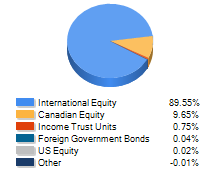
Asset Allocation
(As of March 31, 2024)
|
Sector Allocation
(As of March 31, 2024)
|
Geographic Allocation
(As of March 31, 2024)
|
Top 10 Holdings
| Name | Asset | Sector | Geographic | Percent |
| Cash and Cash Equivalents | Cash and Equivalents | Cash and Cash Equivalent | Canada | 5.36% |
| Ecolab Inc | US Equity | Basic Materials | United States | 4.57% |
| Trex Co Inc | US Equity | Real Estate | United States | 3.86% |
| Amphenol Corp Cl A | US Equity | Technology | United States | 3.60% |
| Denso Corp | International Equity | Consumer Goods | Japan | 3.42% |
| Kingspan Group PLC | International Equity | Real Estate | European Union | 3.37% |
| Garmin Ltd | International Equity | Technology | Other European | 3.35% |
| Tetra Tech Inc | US Equity | Industrial Services | United States | 3.32% |
| Keyence Corp | International Equity | Industrial Goods | Japan | 3.27% |
| Dassault Systemes SE | International Equity | Technology | European Union | 3.18% |
Performance Data
(As of March 31, 2024)
|
|
Return (%)
|
Annualized Return (%)
|
|
Return
|
1
Mth
|
3
Mth
|
6
Mth
|
YTD
|
1
Yr
|
3
Yr
|
5
Yr
|
10
Yr
|
|
Fund
|
1.69
|
6.67
|
14.48
|
6.67
|
7.01
|
2.06
|
-
|
-
|
|
Benchmark
|
2.94
|
10.27
|
20.07
|
10.27
|
23.05
|
9.29
|
11.08
|
10.93
|
|
Quartile Ranking
|
4
|
4
|
4
|
4
|
4
|
4
|
-
|
-
|
|
Calendar Return (%)
|
2023
|
2022
|
2021
|
2020
|
2019
|
2018
|
2017
|
2016
|
2015
|
2014
|
|
Fund
|
8.07
|
-21.90
|
17.30
|
-
|
-
|
-
|
-
|
-
|
-
|
-
|
|
Benchmark
|
19.37
|
-12.64
|
17.62
|
13.15
|
21.41
|
-1.79
|
16.29
|
5.18
|
16.88
|
13.97
|
|
Quartile Ranking
|
4
|
4
|
2
|
-
|
-
|
-
|
-
|
-
|
-
|
-
|