|
iShares S&P/TSX Capped Materials Index ETF (XMA)
|
As of March 31, 2024
|
|
(Natural Resources Equity)
|
|
FundGrade A+
® Rating recipient
For more information about FundGrade
click here
Underlying Index
|
S&P/TSX Capped Materials Index
|
Inception Return
(12/19/2005)
|
4.22 %
|
|
Day High/Low
|
$19.71 / $19.46
|
|
YTD Return
|
5.66 %
|
|
52Week High/Low
|
$20.88 / $15.49
|
|
|
|
|
|
NAVPS
(4/17/2024)
|
$19.52
|
|
Change
|
 $0.15 / 0.78 %
|
Open / Close
(4/17/2024)
|
$19.46
/
$19.51
|
|
|
|
Management Fee
|
0.55 %
|
|
Traded Volume
|
78,265
|
|
Assets ($mil)
|
$135.44
|
|
Rank (1Yr)
|
104/117
|
|
Std Dev (3Yr)
|
27.61 %
|
|
Beta (3Yr)
|
0.95
|
|
Volatility Ranking (3Yr)
|
10/10
|
|
RRSP Eligibility
|
Yes
|
|
Open to Invest
|
Open
|
|
Annual Dividend
|
$0.24
|
|
Annual Yield
|
1.24 %
|
|
|
Objective
The iShares S&P/TSX Capped Materials Index Fund seeks to provide long-term capital growth by replicating, to the extent possible, the performance of the S&P®/TSX® Capped Materials Index through investments in the constituent issuers of such index, net of expenses.
|
Fund Manager
BlackRock Asset Management Canada Limited
Portfolio Manager
BlackRock Asset Management Canada Limited
Sub-Advisor
BlackRock Institutional Trust Company, N.A.
|
|
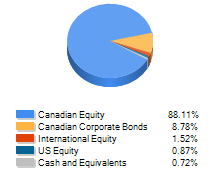
Asset Allocation
(As of March 31, 2024)
|
Sector Allocation
(As of March 31, 2024)
|
Geographic Allocation
(As of March 31, 2024)
|
Top 10 Holdings
| Name | Asset | Sector | Geographic | Percent |
| Agnico Eagle Mines Ltd | Canadian Equity | Basic Materials | Canada | 11.50% |
| Barrick Gold Corp | Canadian Equity | Basic Materials | Canada | 11.32% |
| Nutrien Ltd | Canadian Equity | Basic Materials | Canada | 10.41% |
| Franco-Nevada Corp | Canadian Equity | Basic Materials | Canada | 8.88% |
| Wheaton Precious Metals Corp | Canadian Equity | Basic Materials | Canada | 8.27% |
| Teck Resources Ltd Cl B | Canadian Equity | Basic Materials | Canada | 8.14% |
| First Quantum Minerals Ltd | Canadian Equity | Basic Materials | Canada | 2.95% |
| Kinross Gold Corp | Canadian Equity | Basic Materials | Canada | 2.92% |
| CCL Industries Inc Cl B | Canadian Equity | Basic Materials | Canada | 2.86% |
| Ivanhoe Mines Ltd Cl A | Canadian Equity | Basic Materials | Canada | 2.76% |
Performance Data
(As of March 31, 2024)
|
|
Return (%)
|
Annualized Return (%)
|
|
Return
|
1
Mth
|
3
Mth
|
6
Mth
|
YTD
|
1
Yr
|
3
Yr
|
5
Yr
|
10
Yr
|
|
Fund
|
15.27
|
5.66
|
7.50
|
5.66
|
-3.98
|
5.27
|
8.22
|
4.23
|
|
Benchmark
|
10.75
|
8.69
|
8.09
|
8.69
|
5.74
|
12.02
|
8.22
|
2.10
|
|
Quartile Ranking
|
1
|
4
|
2
|
4
|
4
|
4
|
4
|
3
|
|
Calendar Return (%)
|
2023
|
2022
|
2021
|
2020
|
2019
|
2018
|
2017
|
2016
|
2015
|
2014
|
|
Fund
|
-1.95
|
1.25
|
3.43
|
20.45
|
23.09
|
-9.84
|
7.03
|
40.29
|
-21.47
|
-3.16
|
|
Benchmark
|
-0.78
|
12.86
|
21.57
|
-7.01
|
20.06
|
-15.86
|
-1.69
|
36.74
|
-23.78
|
-5.59
|
|
Quartile Ranking
|
4
|
4
|
4
|
1
|
1
|
1
|
1
|
3
|
3
|
1
|