|
BetaPro S&P/TSX Capped Energy -2x Daily Bear (HED)
|
As of March 31, 2024
|
|
(Passive Inverse/Leveraged)
|
|
Underlying Index
|
S&P/TSX Capped Energy Index
|
Inception Return
(6/18/2007)
|
-29.98 %
|
|
Day High/Low
|
$3.80 / $3.70
|
|
YTD Return
|
-29.33 %
|
|
52Week High/Low
|
$7.79 / $3.46
|
|
|
|
|
|
NAVPS
(4/23/2024)
|
$3.71
|
|
Change
|
 $-0.04 / -0.94 %
|
Open / Close
(4/23/2024)
|
$3.80
/
$3.71
|
|
|
|
Management Fee
|
1.15 %
|
|
Traded Volume
|
23,000
|
|
Assets ($mil)
|
-
|
|
Rank (1Yr)
|
24/26
|
|
Std Dev (3Yr)
|
83.93 %
|
|
Beta (3Yr)
|
-4.07
|
|
Volatility Ranking (3Yr)
|
10/10
|
|
RRSP Eligibility
|
Yes
|
|
Open to Invest
|
Open
|
|
Annual Dividend
|
-
|
|
Annual Yield
|
-
|
|
|
Objective
The HBP Energy Bear+ ETF seeks daily investment results, before fees, expenses, distributions, brokerage commissions and other transaction costs, that endeavour to correspond to two times (200%) the inverse (opposite) of the daily performance of the S&P/TSX Capped Energy Index. The Index includes stocks belonging to the S&P/TSX Energy industry sector classification.
|
Fund Manager
Horizons ETFs Management (Canada) Inc.
Portfolio Manager
Horizons ETFs Management (Canada) Inc.
Sub-Advisor
Data not available
|
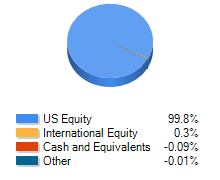
Allocations
Data not available
Top 10 Holdings
Performance Data
(As of March 31, 2024)
|
|
Return (%)
|
Annualized Return (%)
|
|
Return
|
1
Mth
|
3
Mth
|
6
Mth
|
YTD
|
1
Yr
|
3
Yr
|
5
Yr
|
10
Yr
|
|
Fund
|
-16.01
|
-29.33
|
-15.95
|
-29.33
|
-42.28
|
-59.43
|
-54.84
|
-32.92
|
|
Benchmark
|
4.14
|
6.62
|
15.26
|
6.62
|
13.96
|
9.11
|
9.96
|
7.67
|
|
Quartile Ranking
|
4
|
4
|
3
|
4
|
4
|
4
|
4
|
4
|
|
Calendar Return (%)
|
2023
|
2022
|
2021
|
2020
|
2019
|
2018
|
2017
|
2016
|
2015
|
2014
|
|
Fund
|
-13.05
|
-71.72
|
-79.31
|
-43.04
|
-28.83
|
57.82
|
11.03
|
-61.76
|
28.40
|
21.15
|
|
Benchmark
|
11.75
|
-5.84
|
25.09
|
5.60
|
22.88
|
-8.89
|
9.10
|
21.08
|
-8.32
|
10.55
|
|
Quartile Ranking
|
3
|
4
|
4
|
3
|
3
|
1
|
2
|
4
|
1
|
1
|