|
AGF Global Real Assets Fund ETF (AGLR)
|
As of March 31, 2024
|
|
(Global Equity Balanced)
|
|
Underlying Index
|
|
Inception Return
(2/27/2024)
|
-
|
|
Day High/Low
|
- / -
|
|
YTD Return
|
-
|
|
52Week High/Low
|
$26.94 / $25.02
|
|
|
|
|
|
NAVPS
(4/26/2024)
|
$26.64
|
|
Change
|
 $-0.01 / -0.03 %
|
Open / Close
(4/26/2024)
|
-
/
$26.64
|
|
|
|
Management Fee
|
0.60 %
|
|
Traded Volume
|
0
|
|
Assets ($mil)
|
-
|
|
Rank (1Yr)
|
-
|
|
Std Dev (3Yr)
|
-
|
|
Beta (3Yr)
|
-
|
|
Volatility Ranking (3Yr)
|
-
|
|
RRSP Eligibility
|
Yes
|
|
Open to Invest
|
Open
|
|
Annual Dividend
|
-
|
|
Annual Yield
|
-
|
|
|
Objective
The Fund’s objective is to provide portfolio diversification and long-term capital growth. It invests primarily in equities and equity-related securities of companies operating in industries and sectors associated with real assets and located around the world. Real assets include, but are not limited to, infrastructure, energy, precious metals and real estate.
|
Fund Manager
AGF Investments Inc.
Portfolio Manager
Steve Bonnyman, AGF Investments Inc.
Jeff Kay, AGF Investments Inc.
Sub-Advisor
Data not available
|
|
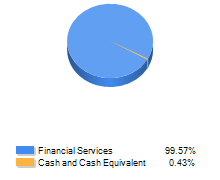
Asset Allocation
(As of March 31, 2024)
|
Sector Allocation
(As of March 31, 2024)
|
Geographic Allocation
(As of March 31, 2024)
|
Top 10 Holdings
| Name | Asset | Sector | Geographic | Percent |
| Cash and Cash Equivalents | Cash and Equivalents | Cash and Cash Equivalent | Canada | 15.59% |
| Marathon Petroleum Corp | US Equity | Energy | United States | 3.55% |
| Canadian Natural Resources Ltd | Canadian Equity | Energy | Canada | 3.44% |
| Exxon Mobil Corp | US Equity | Energy | United States | 3.11% |
| ConocoPhillips | US Equity | Energy | United States | 3.01% |
| Linde PLC | International Equity | Basic Materials | European Union | 2.96% |
| Cenovus Energy Inc | Canadian Equity | Energy | Canada | 2.11% |
| SPDR Gold Shares ETF (GLD) | Other | Exchange Traded Fund | Multi-National | 1.97% |
| Prologis Inc | US Equity | Real Estate | United States | 1.91% |
| Dupont de Nemours Inc | US Equity | Basic Materials | United States | 1.84% |
Performance Data
(As of March 31, 2024)
|
|
Return (%)
|
Annualized Return (%)
|
|
Return
|
1
Mth
|
3
Mth
|
6
Mth
|
YTD
|
1
Yr
|
3
Yr
|
5
Yr
|
10
Yr
|
|
Fund
|
5.22
|
-
|
-
|
-
|
-
|
-
|
-
|
-
|
|
Benchmark
|
2.30
|
7.76
|
16.43
|
7.76
|
17.03
|
6.28
|
8.09
|
8.79
|
|
Quartile Ranking
|
1
|
-
|
-
|
-
|
-
|
-
|
-
|
-
|
|
Calendar Return (%)
|
2023
|
2022
|
2021
|
2020
|
2019
|
2018
|
2017
|
2016
|
2015
|
2014
|
|
Fund
|
-
|
-
|
-
|
-
|
-
|
-
|
-
|
-
|
-
|
-
|
|
Benchmark
|
15.07
|
-12.03
|
11.33
|
12.17
|
16.29
|
0.72
|
11.99
|
3.66
|
17.03
|
13.13
|
|
Quartile Ranking
|
-
|
-
|
-
|
-
|
-
|
-
|
-
|
-
|
-
|
-
|