|
BetaPro NASDAQ-100 2x Daily Bull ETF (HQU)
|
As of March 31, 2024
|
|
(Passive Inverse/Leveraged)
|
|
Underlying Index
|
NASDAQ 100 Index
|
Inception Return
(6/17/2008)
|
22.09 %
|
|
Day High/Low
|
$17.77 / $17.30
|
|
YTD Return
|
14.92 %
|
|
52Week High/Low
|
$19.95 / $10.37
|
|
|
|
|
|
NAVPS
(4/23/2024)
|
$17.69
|
|
Change
|
 $0.51 / 3.00 %
|
Open / Close
(4/23/2024)
|
$17.34
/
$17.68
|
|
|
|
Management Fee
|
1.15 %
|
|
Traded Volume
|
1,440,571
|
|
Assets ($mil)
|
-
|
|
Rank (1Yr)
|
1/26
|
|
Std Dev (3Yr)
|
41.10 %
|
|
Beta (3Yr)
|
1.98
|
|
Volatility Ranking (3Yr)
|
10/10
|
|
RRSP Eligibility
|
Yes
|
|
Open to Invest
|
Open
|
|
Annual Dividend
|
-
|
|
Annual Yield
|
-
|
|
|
Objective
The HBP NASDAQ-100 Bull+ ETF seeks daily investment results, before fees, expenses, distributions, brokerage commissions and other transaction costs, that endeavour to correspond to two times (200%) the daily performance of the NASDAQ-100 Index. The HBP NASDAQ-100 Bull+ ETF is denominated in Canadian dollars. Any U.S. dollar gains or losses as a result of the ETF's investment will be hedged back to the Canadian dollar to the best of the ETF's ability.
|
Fund Manager
Horizons ETFs Management (Canada) Inc.
Portfolio Manager
Horizons ETFs Management (Canada) Inc.
Sub-Advisor
Data not available
|
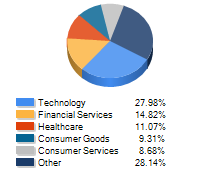
Allocations
Data not available
Top 10 Holdings
Performance Data
(As of March 31, 2024)
|
|
Return (%)
|
Annualized Return (%)
|
|
Return
|
1
Mth
|
3
Mth
|
6
Mth
|
YTD
|
1
Yr
|
3
Yr
|
5
Yr
|
10
Yr
|
|
Fund
|
1.55
|
14.92
|
46.60
|
14.92
|
73.95
|
12.25
|
28.69
|
28.13
|
|
Benchmark
|
4.14
|
6.62
|
15.26
|
6.62
|
13.96
|
9.11
|
9.96
|
7.67
|
|
Quartile Ranking
|
2
|
1
|
1
|
1
|
1
|
1
|
1
|
1
|
|
Calendar Return (%)
|
2023
|
2022
|
2021
|
2020
|
2019
|
2018
|
2017
|
2016
|
2015
|
2014
|
|
Fund
|
113.31
|
-61.67
|
52.12
|
83.85
|
79.22
|
-10.39
|
68.09
|
7.73
|
13.65
|
37.31
|
|
Benchmark
|
11.75
|
-5.84
|
25.09
|
5.60
|
22.88
|
-8.89
|
9.10
|
21.08
|
-8.32
|
10.55
|
|
Quartile Ranking
|
1
|
4
|
2
|
1
|
1
|
2
|
1
|
2
|
1
|
1
|