|
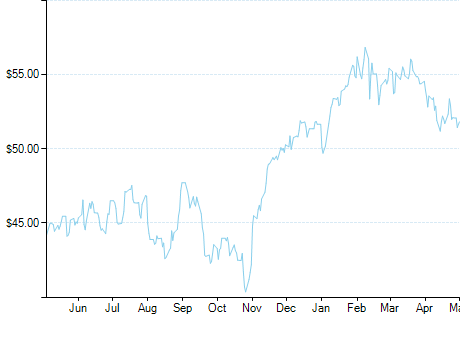
Horizons Gold ETF (HUG)
|
As of March 31, 2024
|
|
(Commodity)
|
|
Underlying Index
|
Solactive Gold Front Month MD Rolling Futures Index ER
|
Inception Return
(6/24/2009)
|
3.87 %
|
|
Day High/Low
|
$18.95 / $18.81
|
|
YTD Return
|
6.98 %
|
|
52Week High/Low
|
$19.09 / $14.50
|
|
|
|
|
|
NAVPS
(4/19/2024)
|
$18.94
|
|
Change
|
 $0.13 / 0.67 %
|
Open / Close
(4/19/2024)
|
$18.81
/
$18.85
|
|
|
|
Management Fee
|
0.65 %
|
|
Traded Volume
|
3,385
|
|
Assets ($mil)
|
-
|
|
Rank (1Yr)
|
28/62
|
|
Std Dev (3Yr)
|
14.54 %
|
|
Beta (3Yr)
|
0.08
|
|
Volatility Ranking (3Yr)
|
7/10
|
|
RRSP Eligibility
|
Yes
|
|
Open to Invest
|
Open
|
|
Annual Dividend
|
-
|
|
Annual Yield
|
-
|
|
|
Objective
The HBP COMEX Gold ETF seeks investment results, before fees, expenses, distributions, brokerage commissions and other transaction costs, that endeavour to correspond to the performance of the COMEX gold futures contract for a subsequent delivery month. Any U.S. dollar gains or losses as a result of the ETF's investment will be hedged back to the Canadian dollar to the best of the ETF's ability.
|
Fund Manager
Horizons ETFs Management (Canada) Inc.
Portfolio Manager
Horizons ETFs Management (Canada) Inc.
Sub-Advisor
Data not available
|
Allocations
Data not available
Top 10 Holdings
Performance Data
(As of March 31, 2024)
|
|
Return (%)
|
Annualized Return (%)
|
|
Return
|
1
Mth
|
3
Mth
|
6
Mth
|
YTD
|
1
Yr
|
3
Yr
|
5
Yr
|
10
Yr
|
|
Fund
|
8.17
|
6.98
|
18.73
|
6.98
|
10.42
|
7.10
|
8.87
|
3.34
|
|
Benchmark
|
4.14
|
6.62
|
15.26
|
6.62
|
13.96
|
9.11
|
9.96
|
7.67
|
|
Quartile Ranking
|
3
|
3
|
2
|
3
|
2
|
3
|
3
|
3
|
|
Calendar Return (%)
|
2023
|
2022
|
2021
|
2020
|
2019
|
2018
|
2017
|
2016
|
2015
|
2014
|
|
Fund
|
11.22
|
-2.03
|
-5.11
|
19.68
|
16.08
|
-4.55
|
10.91
|
6.00
|
-11.91
|
-2.51
|
|
Benchmark
|
11.75
|
-5.84
|
25.09
|
5.60
|
22.88
|
-8.89
|
9.10
|
21.08
|
-8.32
|
10.55
|
|
Quartile Ranking
|
1
|
4
|
2
|
4
|
2
|
4
|
1
|
2
|
4
|
3
|