|
BMO Equal Weight Banks Index ETF (ZEB)
|
As of March 31, 2024
|
|
(Financial Services Equity)
|
|
FundGrade A+
® Rating recipient
For more information about FundGrade
click here
2018
2012
Underlying Index
|
Solactive Equal Weight Canada Banks Index
|
Inception Return
(10/20/2009)
|
10.45 %
|
|
Day High/Low
|
$35.71 / $35.32
|
|
YTD Return
|
5.75 %
|
|
52Week High/Low
|
$37.17 / $29.14
|
|
|
|
|
|
NAVPS
(4/25/2024)
|
$35.66
|
|
Change
|
 $-0.10 / -0.27 %
|
Open / Close
(4/25/2024)
|
$35.54
/
$35.67
|
|
|
|
Management Fee
|
0.25 %
|
|
Traded Volume
|
2,569,725
|
|
Assets ($mil)
|
$2,995.11
|
|
Rank (1Yr)
|
45/71
|
|
Std Dev (3Yr)
|
19.04 %
|
|
Beta (3Yr)
|
1.03
|
|
Volatility Ranking (3Yr)
|
10/10
|
|
RRSP Eligibility
|
Yes
|
|
Open to Invest
|
Open
|
|
Annual Dividend
|
$1.54
|
|
Annual Yield
|
4.32 %
|
|
|
Objective
The ETF seeks to replicate, to the extent possible, the performance of an equal weight diversified Canadian bank index, net of expenses. Currently, the ETF seeks to replicate the performance of the Solactive Equal Weight Canada Banks Index (the “Index”). The Index includes Canadian exchange listed securities in the diversified bank industry. Constituents are subject to minimum market capitalization and liquidity screens.
|
Fund Manager
BMO Asset Management Inc.
Portfolio Manager
BMO Asset Management Inc.
Sub-Advisor
Data not available
|
|
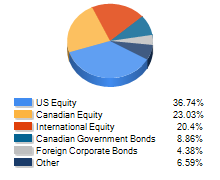
Asset Allocation
(As of March 31, 2024)
|
Sector Allocation
(As of March 31, 2024)
|
Geographic Allocation
(As of March 31, 2024)
|
Top 10 Holdings
| Name | Asset | Sector | Geographic | Percent |
| National Bank of Canada | Canadian Equity | Financial Services | Canada | 16.97% |
| Bank of Montreal | Canadian Equity | Financial Services | Canada | 16.87% |
| Bank of Nova Scotia | Canadian Equity | Financial Services | Canada | 16.77% |
| Canadian Imperial Bank of Commerce | Canadian Equity | Financial Services | Canada | 16.61% |
| Royal Bank of Canada | Canadian Equity | Financial Services | Canada | 16.51% |
| Toronto-Dominion Bank | Canadian Equity | Financial Services | Canada | 16.26% |
| CANADIAN DOLLAR | Cash and Equivalents | Cash and Cash Equivalent | Canada | 0.00% |
Performance Data
(As of March 31, 2024)
|
|
Return (%)
|
Annualized Return (%)
|
|
Return
|
1
Mth
|
3
Mth
|
6
Mth
|
YTD
|
1
Yr
|
3
Yr
|
5
Yr
|
10
Yr
|
|
Fund
|
5.88
|
5.75
|
19.61
|
5.75
|
15.09
|
8.21
|
10.29
|
9.56
|
|
Benchmark
|
3.76
|
9.87
|
21.36
|
9.87
|
25.68
|
9.79
|
8.54
|
8.93
|
|
Quartile Ranking
|
1
|
3
|
2
|
3
|
3
|
2
|
2
|
2
|
|
Calendar Return (%)
|
2023
|
2022
|
2021
|
2020
|
2019
|
2018
|
2017
|
2016
|
2015
|
2014
|
|
Fund
|
10.85
|
-10.38
|
39.26
|
3.63
|
16.05
|
-8.85
|
14.30
|
30.76
|
-5.96
|
13.79
|
|
Benchmark
|
13.41
|
-5.68
|
22.05
|
-5.24
|
19.43
|
-4.99
|
15.24
|
6.34
|
14.20
|
14.35
|
|
Quartile Ranking
|
3
|
2
|
1
|
2
|
3
|
3
|
2
|
1
|
4
|
1
|