|
BMO MSCI China ESG Leaders Index ETF (ZCH)
|
As of March 31, 2024
|
|
(Greater China Equity)
|
|
FundGrade A+
® Rating recipient
For more information about FundGrade
click here
Underlying Index
|
BNY Mellon China Select (ADR) Index
|
Inception Return
(1/19/2010)
|
-0.13 %
|
|
Day High/Low
|
$12.33 / $12.21
|
|
YTD Return
|
-1.98 %
|
|
52Week High/Low
|
$16.06 / $11.28
|
|
|
|
|
|
NAVPS
(4/17/2024)
|
$12.21
|
|
Change
|
 $-0.05 / -0.41 %
|
Open / Close
(4/17/2024)
|
$12.30
/
$12.21
|
|
|
|
Management Fee
|
0.60 %
|
|
Traded Volume
|
13,111
|
|
Assets ($mil)
|
-
|
|
Rank (1Yr)
|
60/69
|
|
Std Dev (3Yr)
|
23.69 %
|
|
Beta (3Yr)
|
0.68
|
|
Volatility Ranking (3Yr)
|
10/10
|
|
RRSP Eligibility
|
Yes
|
|
Open to Invest
|
Open
|
|
Annual Dividend
|
$0.50
|
|
Annual Yield
|
4.10 %
|
|
|
Objective
BMO MSCI China ESG Leaders Index ETF seeks to replicate, to the extent possible, the performance of an ESG-focused broad Chinese equity markets index, net of expenses.
|
Fund Manager
BMO Asset Management Inc.
Portfolio Manager
BMO Asset Management Inc.
Sub-Advisor
Data not available
|
|
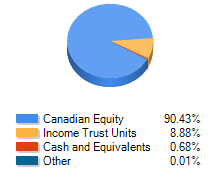
Asset Allocation
(As of March 31, 2024)
|
Sector Allocation
(As of March 31, 2024)
|
Geographic Allocation
(As of March 31, 2024)
|
Top 10 Holdings
| Name | Asset | Sector | Geographic | Percent |
| Tencent Holdings Ltd | International Equity | Technology | Asia/Pacific Rim | 26.01% |
| Alibaba Group Holding Ltd | International Equity | Technology | Asia/Pacific Rim | 14.81% |
| China Construction Bank Corp Cl H | International Equity | Financial Services | Asia/Pacific Rim | 5.85% |
| NetEase Inc | International Equity | Technology | Asia/Pacific Rim | 4.06% |
| Ind and Commercial Bank of China Ltd Cl H | International Equity | Financial Services | Asia/Pacific Rim | 3.31% |
| JD.com Inc | International Equity | Consumer Services | Asia/Pacific Rim | 3.22% |
| Baidu Inc | International Equity | Technology | Asia/Pacific Rim | 2.98% |
| Byd Co Ltd Cl H | International Equity | Consumer Goods | Asia/Pacific Rim | 2.69% |
| Li Auto Inc | International Equity | Consumer Goods | Asia/Pacific Rim | 1.78% |
| Yum China Holdings Inc | International Equity | Consumer Services | Asia/Pacific Rim | 1.64% |
Performance Data
(As of March 31, 2024)
|
|
Return (%)
|
Annualized Return (%)
|
|
Return
|
1
Mth
|
3
Mth
|
6
Mth
|
YTD
|
1
Yr
|
3
Yr
|
5
Yr
|
10
Yr
|
|
Fund
|
0.81
|
-1.98
|
-9.55
|
-1.98
|
-20.64
|
-25.55
|
-12.17
|
-1.37
|
|
Benchmark
|
-0.38
|
-1.58
|
-5.53
|
-1.58
|
-19.39
|
-8.74
|
-2.78
|
4.40
|
|
Quartile Ranking
|
3
|
4
|
4
|
4
|
4
|
4
|
4
|
4
|
|
Calendar Return (%)
|
2023
|
2022
|
2021
|
2020
|
2019
|
2018
|
2017
|
2016
|
2015
|
2014
|
|
Fund
|
-12.68
|
-21.99
|
-42.01
|
37.77
|
17.25
|
-16.49
|
37.33
|
-8.15
|
19.58
|
10.87
|
|
Benchmark
|
-12.56
|
-21.94
|
7.65
|
26.06
|
25.82
|
-27.74
|
5.92
|
-22.11
|
39.34
|
56.37
|
|
Quartile Ranking
|
2
|
3
|
4
|
2
|
2
|
3
|
2
|
4
|
1
|
3
|