|
BMO Global Infrastructure Index ETF (ZGI)
|
As of March 31, 2024
|
|
(Global Infrastructure Equity)
|
|
FundGrade A+
® Rating recipient
For more information about FundGrade
click here
2022
2021
2020
2019
Underlying Index
|
Dow Jones Brookfield Global Infrastructure North American Listed Index
|
Inception Return
(1/20/2010)
|
10.82 %
|
|
Day High/Low
|
$41.95 / $41.82
|
|
YTD Return
|
2.61 %
|
|
52Week High/Low
|
$44.47 / $37.28
|
|
|
|
|
|
NAVPS
(4/19/2024)
|
$41.92
|
|
Change
|
 $0.57 / 1.38 %
|
Open / Close
(4/19/2024)
|
$41.84
/
$41.93
|
|
|
|
Management Fee
|
0.55 %
|
|
Traded Volume
|
1,645
|
|
Assets ($mil)
|
$620.45
|
|
Rank (1Yr)
|
66/137
|
|
Std Dev (3Yr)
|
14.00 %
|
|
Beta (3Yr)
|
0.62
|
|
Volatility Ranking (3Yr)
|
7/10
|
|
RRSP Eligibility
|
Yes
|
|
Open to Invest
|
Open
|
|
Annual Dividend
|
$1.40
|
|
Annual Yield
|
3.34 %
|
|
|
Objective
BMO Global Infrastructure Index ETF has been designed to replicate, to the extent possible, the performance of the Dow Jones Brookfield Global Infrastructure North American Listed Index (Index), net of expenses.
|
Fund Manager
BMO Asset Management Inc.
Portfolio Manager
BMO Asset Management Inc.
Sub-Advisor
Data not available
|
|
Asset Allocation
(As of March 31, 2024)
|
Sector Allocation
(As of March 31, 2024)
|
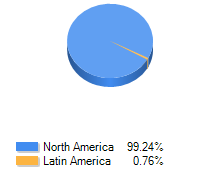
Geographic Allocation
(As of March 31, 2024)
|
Top 10 Holdings
| Name | Asset | Sector | Geographic | Percent |
| American Tower Corp | US Equity | Real Estate | United States | 9.41% |
| Enbridge Inc | Canadian Equity | Energy | Canada | 8.26% |
| National Grid PLC - ADR | International Equity | Utilities | European Union | 5.47% |
| Williams Cos Inc | US Equity | Energy | United States | 5.10% |
| ONEOK Inc | US Equity | Energy | United States | 5.02% |
| Crown Castle International Corp | US Equity | Real Estate | United States | 4.94% |
| Sempra Energy | US Equity | Utilities | United States | 4.86% |
| TC Energy Corp | Canadian Equity | Energy | Canada | 4.48% |
| Cheniere Energy Inc | US Equity | Energy | United States | 4.13% |
| Exelon Corp | US Equity | Utilities | United States | 4.02% |
Performance Data
(As of March 31, 2024)
|
|
Return (%)
|
Annualized Return (%)
|
|
Return
|
1
Mth
|
3
Mth
|
6
Mth
|
YTD
|
1
Yr
|
3
Yr
|
5
Yr
|
10
Yr
|
|
Fund
|
3.59
|
2.61
|
12.29
|
2.61
|
2.20
|
8.06
|
5.67
|
7.70
|
|
Benchmark
|
2.94
|
10.27
|
20.07
|
10.27
|
23.05
|
9.29
|
11.08
|
10.93
|
|
Quartile Ranking
|
2
|
2
|
1
|
2
|
2
|
1
|
1
|
1
|
|
Calendar Return (%)
|
2023
|
2022
|
2021
|
2020
|
2019
|
2018
|
2017
|
2016
|
2015
|
2014
|
|
Fund
|
-0.64
|
4.77
|
26.37
|
-10.42
|
25.14
|
-0.39
|
2.86
|
17.28
|
-4.05
|
30.27
|
|
Benchmark
|
19.37
|
-12.64
|
17.62
|
13.15
|
21.41
|
-1.79
|
16.29
|
5.18
|
16.88
|
13.97
|
|
Quartile Ranking
|
4
|
1
|
1
|
3
|
1
|
2
|
4
|
1
|
4
|
1
|