|
WisdomTree Japan Total Dividend ETF (DXJ)
|
Data not available
|
|
(Geographic Equity)
|
|
Underlying Index
|
WisdomTree Japan Hedged Equity Index
|
Inception Return
(6/16/2006)
|
-
|
|
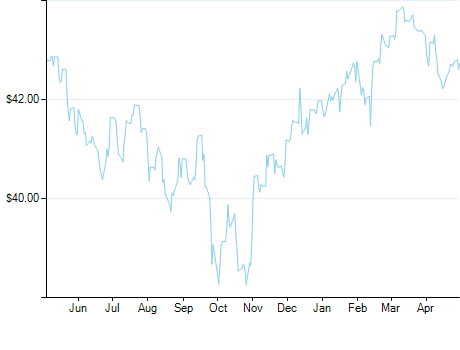
Day High/Low
|
$105.78 / $105.12
|
|
YTD Return
|
-
|
|
52Week High/Low
|
$109.95 / $71.06
|
|
|
|
|
|
NAVPS
()
|
-
|
|
Change
|
 - / -
- / -
|
Open / Close
(4/19/2024)
|
$105.47
/
$105.42
|
|
|
|
Management Fee
|
-
|
|
Traded Volume
|
847,675
|
|
Assets ($mil)
|
-
|
|
Rank (1Yr)
|
-
|
|
Std Dev (3Yr)
|
-
|
|
Beta (3Yr)
|
-
|
|
Volatility Ranking (3Yr)
|
-
|
|
RRSP Eligibility
|
Yes
|
|
Open to Invest
|
Open
|
|
Annual Dividend
|
$2.70
|
|
Annual Yield
|
2.56 %
|
|
|
Objective
WisdomTree Japan Hedged Equity Fund is an exchange-traded fund incorporated in the USA. The Fund seeks investment results that correspond to the WisdomTree Japan Hedged Equity Index. The Fund invests in dividend paying companies incorporated in Japan and listed on the Tokyo Stock Exchange while neutralizing the risk of the Japanese yen's fluctuations relative to the USD.
|
Fund Manager
Data not available
Portfolio Manager
Data not available
Sub-Advisor
Data not available
|
|
Asset Allocation
(As of March 31, 2024)
|
Sector Allocation
(As of March 31, 2024)
|
Geographic Allocation
(As of March 31, 2024)
|
Top 10 Holdings
| Name | Asset | Sector | Geographic | Percent |
| Toyota Motor Corp | International Equity | Consumer Goods | Japan | 5.79% |
| Mitsubishi UFJ Financial Group Inc | International Equity | Financial Services | Japan | 4.85% |
| Mitsubishi Corp | International Equity | Industrial Services | Japan | 3.92% |
| Japan Tobacco Inc | International Equity | Consumer Goods | Japan | 3.79% |
| Shin-Etsu Chemical Co Ltd | International Equity | Basic Materials | Japan | 2.77% |
| Sumitomo Mitsui Financial Group Inc | International Equity | Financial Services | Japan | 2.53% |
| Mizuho Financial Group Inc | International Equity | Financial Services | Japan | 2.51% |
| Tokyo Electron Ltd | International Equity | Technology | Japan | 2.17% |
| Tokio Marine Holdings Inc | International Equity | Financial Services | Japan | 1.90% |
| Hitachi Ltd | International Equity | Industrial Goods | Japan | 1.88% |
Performance Data
(Data not available)
|
|
Return (%)
|
Annualized Return (%)
|
|
Return
|
1
Mth
|
3
Mth
|
6
Mth
|
YTD
|
1
Yr
|
3
Yr
|
5
Yr
|
10
Yr
|
|
Fund
|
-
|
-
|
-
|
-
|
-
|
-
|
-
|
-
|
|
Benchmark
|
4.30
|
4.07
|
15.01
|
4.07
|
13.82
|
6.42
|
9.65
|
5.50
|
|
Quartile Ranking
|
-
|
-
|
-
|
-
|
-
|
-
|
-
|
-
|
|
Calendar Return (%)
|
2023
|
2022
|
2021
|
2020
|
2019
|
2018
|
2017
|
2016
|
2015
|
2014
|
|
Fund
|
-
|
-
|
-
|
-
|
-
|
-
|
-
|
-
|
-
|
-
|
|
Benchmark
|
14.44
|
-11.86
|
25.62
|
7.72
|
29.06
|
-16.21
|
16.79
|
24.77
|
-23.03
|
1.21
|
|
Quartile Ranking
|
-
|
-
|
-
|
-
|
-
|
-
|
-
|
-
|
-
|
-
|