|
BMO Low Volatility International Eq HgC$ ETF (ZLD)
|
As of March 31, 2024
|
|
(International Equity)
|
|
FundGrade A+
® Rating recipient
For more information about FundGrade
click here
Underlying Index
|
|
Inception Return
(2/10/2016)
|
6.67 %
|
|
Day High/Low
|
$26.50 / $26.37
|
|
YTD Return
|
5.00 %
|
|
52Week High/Low
|
$26.93 / $23.63
|
|
|
|
|
|
NAVPS
(4/23/2024)
|
$26.53
|
|
Change
|
 $0.14 / 0.54 %
|
Open / Close
(4/23/2024)
|
$26.37
/
$26.50
|
|
|
|
Management Fee
|
0.40 %
|
|
Traded Volume
|
1,611
|
|
Assets ($mil)
|
$23.36
|
|
Rank (1Yr)
|
459/742
|
|
Std Dev (3Yr)
|
12.77 %
|
|
Beta (3Yr)
|
0.87
|
|
Volatility Ranking (3Yr)
|
5/10
|
|
RRSP Eligibility
|
Yes
|
|
Open to Invest
|
Open
|
|
Annual Dividend
|
$0.68
|
|
Annual Yield
|
2.57 %
|
|
|
Objective
BMO Low Volatility International Equity Hedged to CAD ETF has been designed to provide exposure to a low beta weighted portfolio of international stocks in developed countries outside of North America. Beta measures the security's sensitivity to market movements.
|
Fund Manager
BMO Asset Management Inc.
Portfolio Manager
BMO Asset Management Inc.
Sub-Advisor
Data not available
|
|
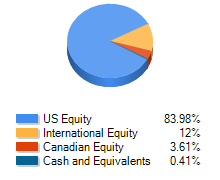
Asset Allocation
(As of March 31, 2024)
|
Sector Allocation
(As of March 31, 2024)
|
Geographic Allocation
(As of March 31, 2024)
|
Top 10 Holdings
| Name | Asset | Sector | Geographic | Percent |
| BMO Low Volatility International Equity ETF (ZLI) | International Equity | Exchange Traded Fund | Multi-National | 99.06% |
| CAD Currency Forward | Cash and Equivalents | Cash and Cash Equivalent | Canada | 1.21% |
| CANADIAN DOLLAR | Cash and Equivalents | Cash and Cash Equivalent | Canada | 0.02% |
| EURO CURRENCY | Cash and Equivalents | Cash and Cash Equivalent | Other European | 0.01% |
| SINGAPORE DOLLAR | Cash and Equivalents | Cash and Cash Equivalent | Asia/Pacific Rim | 0.00% |
| CHF Currency Forward | Cash and Equivalents | Cash and Cash Equivalent | Other European | 0.00% |
| ILS Currency Forward | Cash and Equivalents | Cash and Cash Equivalent | Africa and Middle East | 0.00% |
| USD Currency Forward | Cash and Equivalents | Cash and Cash Equivalent | United States | 0.00% |
| AUD Currency Forward | Cash and Equivalents | Cash and Cash Equivalent | Asia/Pacific Rim | -0.01% |
| HKD Currency Forward | Cash and Equivalents | Cash and Cash Equivalent | Asia/Pacific Rim | -0.01% |
Performance Data
(As of March 31, 2024)
|
|
Return (%)
|
Annualized Return (%)
|
|
Return
|
1
Mth
|
3
Mth
|
6
Mth
|
YTD
|
1
Yr
|
3
Yr
|
5
Yr
|
10
Yr
|
|
Fund
|
2.73
|
5.00
|
10.49
|
5.00
|
10.93
|
6.03
|
4.29
|
-
|
|
Benchmark
|
3.12
|
7.59
|
16.68
|
7.59
|
15.23
|
5.89
|
7.22
|
6.93
|
|
Quartile Ranking
|
3
|
4
|
4
|
4
|
3
|
2
|
4
|
-
|
|
Calendar Return (%)
|
2023
|
2022
|
2021
|
2020
|
2019
|
2018
|
2017
|
2016
|
2015
|
2014
|
|
Fund
|
12.61
|
-7.68
|
12.64
|
-5.53
|
16.88
|
1.07
|
12.61
|
-
|
-
|
-
|
|
Benchmark
|
15.74
|
-10.67
|
8.97
|
8.01
|
16.27
|
-6.81
|
18.37
|
-1.70
|
19.41
|
4.12
|
|
Quartile Ranking
|
3
|
2
|
1
|
4
|
3
|
1
|
4
|
-
|
-
|
-
|