|
AGF Systematic Emerging Markets Equity ETF (QEM)
|
As of March 31, 2024
|
|
(Emerging Markets Equity)
|
|
Underlying Index
|
|
Inception Return
(1/30/2017)
|
2.23 %
|
|
Day High/Low
|
- / -
|
|
YTD Return
|
5.75 %
|
|
52Week High/Low
|
$26.24 / $21.77
|
|
|
|
|
|
NAVPS
(4/25/2024)
|
$24.44
|
|
Change
|
 $-0.21 / -0.85 %
|
Open / Close
(4/25/2024)
|
-
/
$26.24
|
|
|
|
Management Fee
|
0.45 %
|
|
Traded Volume
|
0
|
|
Assets ($mil)
|
-
|
|
Rank (1Yr)
|
219/314
|
|
Std Dev (3Yr)
|
12.53 %
|
|
Beta (3Yr)
|
0.88
|
|
Volatility Ranking (3Yr)
|
7/10
|
|
RRSP Eligibility
|
Yes
|
|
Open to Invest
|
Open
|
|
Annual Dividend
|
$0.57
|
|
Annual Yield
|
2.17 %
|
|
|
Objective
AGF Systematic Emerging Markets Equity ETF seeks to provide long-term capital appreciation with reduced volatility, over a full market cycle, by investing primarily in equity securities of emerging market issuers.
|
Fund Manager
AGF Investments Inc.
Portfolio Manager
Robert Yan, AGF Investments Inc.
Grant Wang, AGF Investments Inc.
Lei Wan, AGF Investments Inc.
Sub-Advisor
Data not available
|
|
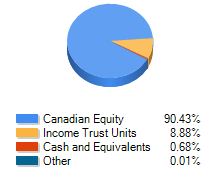
Asset Allocation
(As of March 31, 2024)
|
Sector Allocation
(As of March 31, 2024)
|
Geographic Allocation
(As of March 31, 2024)
|
Top 10 Holdings
| Name | Asset | Sector | Geographic | Percent |
| Taiwan Semiconductor Manufactrg Co Ltd | International Equity | Technology | Asia/Pacific Rim | 9.46% |
| Samsung Electronics Co Ltd | International Equity | Technology | Other Asian | 5.06% |
| Tencent Holdings Ltd | International Equity | Technology | Asia/Pacific Rim | 2.59% |
| Alibaba Group Holding Ltd | International Equity | Technology | Asia/Pacific Rim | 1.68% |
| Xiaomi Corp | International Equity | Technology | Asia/Pacific Rim | 1.47% |
| PetroChina Co Ltd Cl H | International Equity | Energy | Asia/Pacific Rim | 1.38% |
| Southern Copper Corp | US Equity | Basic Materials | United States | 1.37% |
| Fomento Economico Mexicano SAB de CV - Units | Income Trust Units | Consumer Goods | Latin America | 1.30% |
| China Merchants Bank Co Ltd Cl H | International Equity | Financial Services | Asia/Pacific Rim | 1.25% |
| Zomato Ltd | International Equity | Consumer Services | Other Asian | 1.25% |
Performance Data
(As of March 31, 2024)
|
|
Return (%)
|
Annualized Return (%)
|
|
Return
|
1
Mth
|
3
Mth
|
6
Mth
|
YTD
|
1
Yr
|
3
Yr
|
5
Yr
|
10
Yr
|
|
Fund
|
2.54
|
5.75
|
11.58
|
5.75
|
6.48
|
-4.09
|
-0.41
|
-
|
|
Benchmark
|
1.24
|
4.58
|
9.24
|
4.58
|
8.92
|
-1.06
|
3.16
|
5.74
|
|
Quartile Ranking
|
2
|
2
|
2
|
2
|
3
|
3
|
4
|
-
|
|
Calendar Return (%)
|
2023
|
2022
|
2021
|
2020
|
2019
|
2018
|
2017
|
2016
|
2015
|
2014
|
|
Fund
|
5.71
|
-16.98
|
-3.57
|
6.45
|
9.25
|
-4.94
|
-
|
-
|
-
|
-
|
|
Benchmark
|
7.03
|
-12.38
|
0.08
|
11.45
|
15.55
|
-6.05
|
26.42
|
7.90
|
2.69
|
8.76
|
|
Quartile Ranking
|
3
|
3
|
3
|
4
|
4
|
1
|
-
|
-
|
-
|
-
|